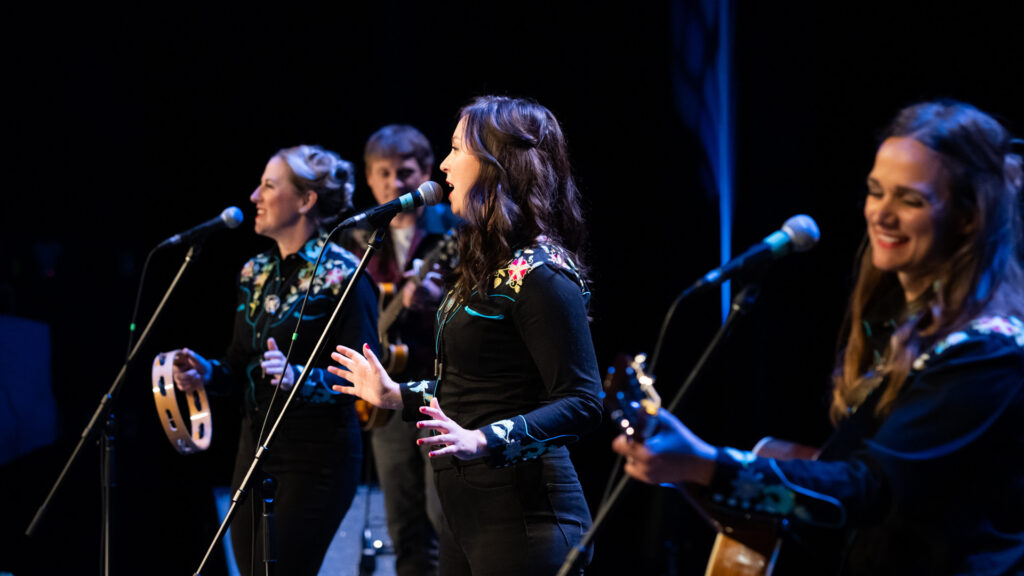
What does Labour Day actually mean for the 40,000 live performance workers who were laid off or who lost their gigs since the beginning of the COVID crisis?
While the Canadian economy is slowly recovering, another 6,600 live performance workers lost their job in August. Job losses in the performing arts, spectator sports and related industries now total 40,700 (26.7% less than a year ago for the same period).
In order to provide a detailed picture of job losses in the arts, culture and heritage sub-sectors during the COVID-19 crisis, CAPACOA licenced access to custom employment statistics from Statistics Canada. These statistics are from the Labour Force Survey, a monthly survey of approximately 56,000 households. They provide an account of employment for full-time, part-time and occasional employees, as well as self-employed workers.
Key findings for August 2020
- Employment in information and cultural industries [51] went down 2.3% in August but it remained slightly above pre-COVID level. The decrease came mainly from other information services [519] (-7,600 jobs) and broadcasting [515] (-3,200). Total actual hours worked in information and cultural industries was down 2.2% which is essentially the same as before the COVID.
- Employment in the arts, entertainment and recreation sector [71] increased 2.2% in August. This increase is exclusively due to an important rebound in the amusement, gambling and recreation industries [713]. Total actual hours worked in the arts, entertainment and recreation sector went up 2.4% but was still 36.2% than a year ago for the same period.
- Performing arts, spectator sports and related industries [711] lost 6,600 jobs in August (-5.6%). This fall back negates all job gains since April. Employment is now 26.7% lower than a year ago. This is even worse than in April, when employment was 24.8% below pre-COVID level.
- In spite of these job losses, total actual hours worked in performing arts, spectator sports and related industries [711] increased 4.8% in August. This means those still employed worked considerably more hours. Average actual hours (all workers, main job) have been increasing steadily since April, going from 13.8 to 21.9 hours per week. Total and average hours worked nonetheless remain way below pre-COVID level (-40.8% and -19.2%, respectively).
Table 1 – Employment estimates (x 1,000), by selected industries, Canada, unadjusted for seasonality
| Industry (with NAICS classification) | Employment, Aug. 2020 (x 1,000) | c. previous month (x1,000) | c. previous month (%) | Aug. 2020 c. Aug. 2019 (x 1,000) | Aug. 2020 c. Aug. 2019 (%) |
|---|---|---|---|---|---|
| Total, all industries | 18289.5 | 219.9 | 1.2% | -1028.4 | -5.3% |
| 51, 71 Information, culture and recreation 1 | 755.8 | 0.3 | 0.0% | -125.8 | -14.3% |
| 51 Information and cultural industries | 350.9 | -8.4 | -2.3% | 2.9 | 0.8% |
| 71 Arts, entertainment and recreation | 404.9 | 8.7 | 2.2% | -128.7 | -24.1% |
| 711 Performing arts, spectator sports and related industries | 111.9 | -6.6 | -5.6% | -40.7 | -26.7% |
| 7111 Performing arts companies 2 | 17.5 | -5.9 | -25.2% | -19.9 | -53.2% |
| 7112 Spectator sports 3 | x | x | x | x | x |
| 7113 Promoters (presenters) of performing arts, sports and similar events 2 | 9.4 | x | x | -9.8 | -51.0% |
| 7114 Agents and managers for artists, athletes, entertainers and other public figures 3 | x | x | x | x | x |
| 7115 Independent artists, writers and performers | 76.2 | -1 | -1.3% | 4.1 | 5.7% |
| 712 Heritage institutions | 39 | -1.6 | -3.9% | -9.6 | -19.8% |
| 713 Amusement, gambling and recreation industries | 254 | 16.8 | 7.1% | -78.4 | -23.6% |
Notes
- This series aggregates two distinct industry classifications. Statistics Canada aggregates culture industries in such a way in order to ensure data quality at small geographic levels. This aggregated series is included in order to enable some degree of comparisons with data tables published by Statistics Canada.
- The sample for this series is small, but data accuracy is acceptable.
- Data is unreliable and unsuited for release.
Table 2 – Total actual hours worked estimates (x 1,000), by selected industries, Canada, unadjusted for seasonality
| Industry (with NAICS classification) | Total actual hours (x 1,000), Aug. 2020 | c. previous month (%) | Aug. 2020 c. Aug. 2019 (%) |
|---|---|---|---|
| Total, all industries | 545265.8 | 0.2% | -8.7% |
| 51, 71 Information, culture and recreation 1 | 20938.7 | -0.1% | -21.2% |
| 51 Information and cultural industries | 11050.7 | -2.2% | -0.1% |
| 71 Arts, entertainment and recreation | 9888 | 2.4% | -36.2% |
| 711 Performing arts, spectator sports and related industries 2 | 2450.3 | 4.8% | -40.8% |
| 7111 Performing arts companies 3 | 373.7 | 0.5% | -61.5% |
| 7112 Spectator sports 3 | x | x | x |
| 7113 Promoters (presenters) of performing arts, sports and similar events 3 | x | x | x |
| 7114 Agents and managers for artists, athletes, entertainers and other public figures 3 | x | x | x |
| 7115 Independent artists, writers and performers | 1558 | 3.9% | -13.3% |
| 712 Heritage institutions | 1225.9 | -10.7% | -25.8% |
| 713 Amusement, gambling and recreation industries | 6211.9 | 4.4% | -36.1% |
Notes
- This series aggregates two distinct industry classifications. Statistics Canada aggregates culture industries in such a way in order to ensure data quality at small geographic levels. This aggregated series is included in order to enable some degree of comparisons with data tables published by Statistics Canada.
- The sample for this series is small, but data accuracy is acceptable.
- Data is unreliable and unsuited for release.
Additional notes to readers
- “Employment” includes full-time, part-time and occasional employees, as well as self-employed workers who worked during the reference week, no matter how many hours. Certain sub-sectors that include a large proportion of self-employed workers, for example independent artists, may therefore not show a significant drop because those freelance workers may still have been considered “working”.
- “Total actual hours worked” is a good indicator of the impacts of COVID-related restrictions on the labour force, because it offers an account of both the number of employed workers and the hours they worked. It is a particularly relevant indicator for sub-sectors that include a lot of freelance and occasional workers (and who may be deemed as “employed” even if they only worked a few hours during the reference period). For example, employment among independent artists dropped only -1.1% between June 2020 and June 2019. However, actual hours worked dropped 35.9% over the same period.
- These statistics are not adjusted for seasonality (whereas many Statistics Canada tables are). Many culture industries are subject to significant seasonal variations. In order to have a fair estimation of employment change compared to pre-COVID level, it is therefore preferable to establish comparisons with the same period in 2019 rather than with February 2020.
- The “711 Performing arts, spectator sports and related industries” sub-sector is a larger industry grouping than the “Live Performance” domain used in the Culture Satellite Account, but it is a fair proxy that can be tracked over time. The 711 sub-sector involves activities that aren’t part of the live performance domain such as 7112 Spectator sports, as well as parts of 7113, 7114 and 7115. Definitions for each industry group are available in the North American Industry Classification System 2017. More details on the mapping between NAICS 711 and the live performance domain can be found in the Classification Guide for the Canadian Framework for Culture Statistics 2011.
- Equivalent employment statistics for other sectors of the Canadian economy can be found in Table 14-10-0022-01 Labour force characteristics by industry, monthly, unadjusted for seasonality.
More information
More statistics from the Labour Force Survey in The Daily
Employment in arts and culture industries, July 2020
Prepared by: Frédéric Julien, Director of Research and Development.


Pingback: Employment in arts and culture industries, September 2020 - CAPACOA