After a tough year’s start amid the sixth wave of the pandemic, the live performance sector bounced back in the second quarter of the year. The nominal gross domestic product (GDP) for the live performance domain increased 10.4% during the second quarter of 2022, reaching $740 million. Employment increased 6.8%, to 67,500 jobs. Although these signs of recovery are encouraging, the live performance domain is not quite yet beating the drum at an allegro tempo.
Gross domestic product on the rise
Looking at real GDP, which takes inflation into account, the live performance domain increased 9.6% in the second quarter of 2022. This was a much faster growth than the culture GDP (2.2%) or the Canadian economy as a whole (2.7%).
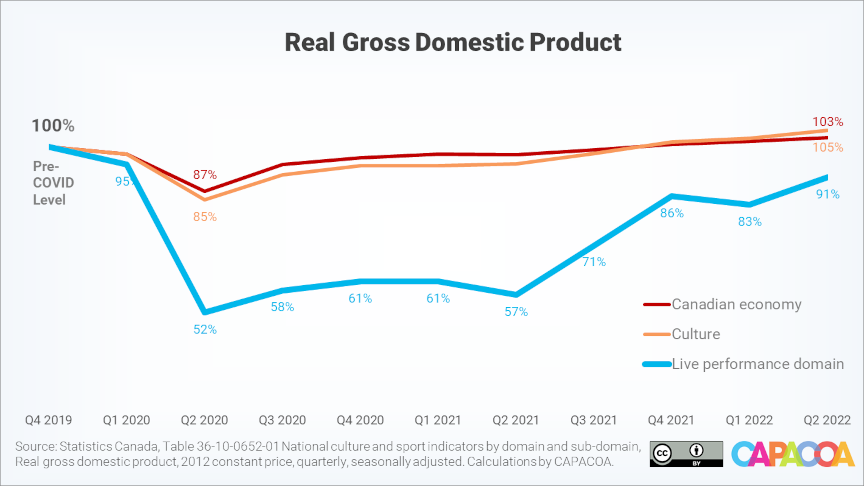
This being said, the live performance domain remained 8.8% below its pre-pandemic real GDP level.
Additionally, the sector’s real GDP growth may have been driven to a greater extent by an increase in the number of performances rather than by an increase in the number of admissions. Indeed, according to anecdotal and quantitative information collected by CAPACOA in July, performing arts organizations are presenting more performances than ever before, as they finish rescheduling performances that were postponed during the pandemic. At the same time, CAPACOA members reported that their audiences were on average 19% lower than before the pandemic.
Note: Data for the National Culture Indicators was revised by Statistics Canada (see below). As a result of this revision, data points in this analysis differ from data points in our previous publications.
Job growth continued
Employment in the live performance domain grew 8.1% during the second quarter of 2022, reaching 67,479 jobs. This was the fourth consecutive quarterly increase.

Compared to the last quarter of 2019, employment in the live performance domain is now 8.9% below its pre-pandemic level.
Data animation
The above presentation shows quarterly fluctuations of real gross domestic product in each of the nine culture domains. The real GDP levels in the fourth quarter of 2019 are used as the baseline to calculate indices for each domain.
Data tables
Real gross domestic product (x 1,000) by domain of culture
| Domain | Q4 2019 | Q2 2022 | Compared to pre-COVID (%) |
|---|---|---|---|
| Culture total | 13,599,011 | 14,258,022 | 4.8% |
| Heritage and libraries | 172,229 | 151,900 | -11.8% |
| Live performance | 669,870 | 611,031 | -8.8% |
| Visual and applied arts | 2,685,078 | 2,849,221 | 6.1% |
| Written and published works | 1,776,264 | 1,579,338 | -11.1% |
| Audio-visual and interactive media | 5,247,411 | 5,785,727 | 10.3% |
| Sound recording | 155,608 | 163,877 | 5.3% |
| Education and training | 780,076 | 829,321 | 6.3% |
| Governance, funding and professional support | 1,860,699 | 2,014,290 | 8.3% |
| Multi domain | 251,775 | 273,316 | 8.6% |
Jobs by domain of culture
| Domain | Q4 2019 | Q2 2022 | Compared to pre-COVID | Compared to pre-COVID (%) |
|---|---|---|---|---|
| Culture total | 679,040 | 692,986 | 13,946 | 2.1% |
| Heritage and libraries | 18,612 | 16,691 | -1,921 | -10.3% |
| Live performance | 74,108 | 67,479 | -6,629 | -8.9% |
| Visual and applied arts | 147,002 | 157,899 | 10,897 | 7.4% |
| Written and published works | 104,437 | 91,256 | -13,181 | -12.6% |
| Audio-visual and interactive media | 175,544 | 195,044 | 19,500 | 11.1% |
| Sound recording | 7,717 | 7,460 | -257 | -3.3% |
| Education and training | 53,880 | 55,304 | 1,424 | 2.6% |
| Governance, funding and professional support | 87,558 | 90,952 | 3,394 | 3.9% |
| Multi domain | 10,182 | 10,902 | 720 | 7.1% |
More information
The National Culture Indicators in The Daily
National Culture Indicators for the first quarter of 2022
About the National Culture Indicators
- Data revisions: Data for the first quarter of 2018 to the first quarter of 2022 have been revised by Statistics Canada. Figures in this analysis may therefore not align with previous analyses.
- The National Culture Indicators (NCI) provide timely and detailed economic statistics about the culture sector. The NCI are an extension of the Culture Satellite Account. They were developed by the Culture Statistics Strategy Consortium, of which CAPACOA is an active member. Before the NCI, CAPACOA used to rely on the Labour Force Survey to monitor employment in the arts sector.
- Gross domestic product (GDP) is a measure of economic activity, defined as the total value of final goods and services produced within the limits of a given geographic area during a given time period.
- Culture GDP is the value added related to the production of culture goods and services across the economy, regardless of the producing industry.
- Real GDP figures are in constant 2012 dollars – they take inflation into account. Nominal GDP figures are in current dollars.
- Culture jobs are the number of jobs that are related to the production of culture goods and services.
- Culture is dominated by large seasonal fluctuations exhibiting similar patterns from one year to the next. For the convenience of users, these regular variations are removed from the NCI, through a statistical technique known as seasonal adjustment, to help isolate underlying trends.
- Culture Satellite Account statistics are grouped by domains and subdomains. The definitions of culture domains and subdomains can be found in the Conceptual Framework for Culture Statistics 2011. Mapping between culture domains and the North American Industry Classification System can be found in the Classification Guide for the Canadian Framework for Culture Statistics 2011.
Prepared by: Frédéric Julien, Director of Research and Development, CAPACOA.