Trends Among Recipients of the Canada Arts Presentation Fund, 2003-2012
Did you know that Canadian presenting organizations pay artistic fees estimated at more than $ 200 million per year? This is one of the findings from a unique data sharing agreement between Canadian Heritage and CAPACOA.
Introduction
Since October 2013, Canadian Heritage and CAPACOA have an ongoing data sharing agreement. This agreement enables CAPACOA to access aggregated data from clients of the Canada Arts Presentation Fund (CAPF) for the purposes of tracking changes and trends in the presentation field.
This agreement has facilitated an ongoing dialogue between Canadian Heritage and CAPACOA on performance measurement. It also enabled us to put into perspective findings from the Value of Presenting Survey of Presenters, as well as of the 2014 Grouped Arts Evaluation.
The Canada Arts Presentation Fund provides funding to roughly 600 hundred clients and represents a significant source of data on the presenting sector. Canadian Heritage shared aggregate data from all completed final reports: a 90% completion rate. As with the Survey of Presenters, there is considerable variation among presenters based on their scope. Extreme values by the largest presenters tend to skew the averages. Figures must consequently be interpreted with caution.
This report present data for the period from 2003-2004 to 2011-2012. 2003-2004 is the fiscal when the CAPF (back then named Arts Presentation Canada) was fully incepted.
Revenues and Expenses
The following tables present the revenue and expense allocations by budget size.
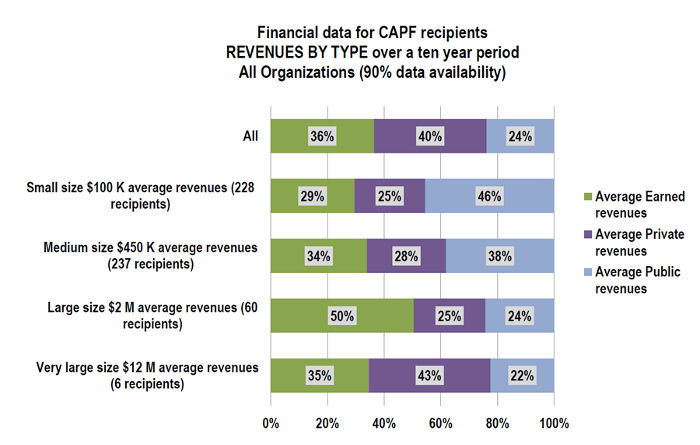
The revenues allocations display significant variations according to budget size. Small presenters are more dependent on public revenues (46% of their total revenues). Large presenters can rely on 50% of earned revenues. The six very large presenters derive most of their revenues from private sources.

There is less variation among expense types. Presentation expense is the largest expense category for all presenters and it represents 43% of small presenters’ expenses. It is followed by marketing expenses and venue expenses.
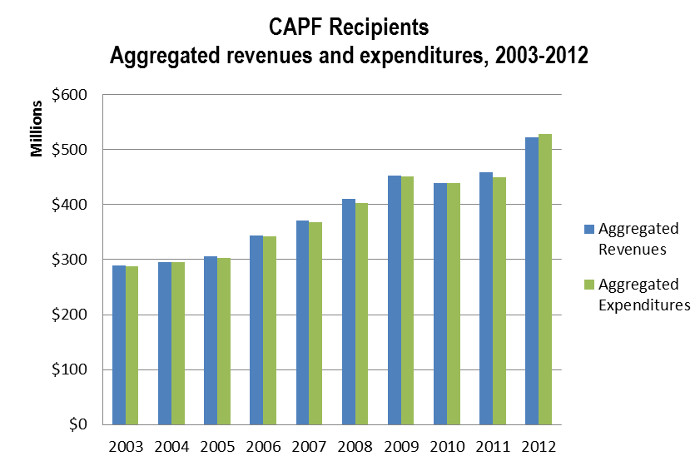

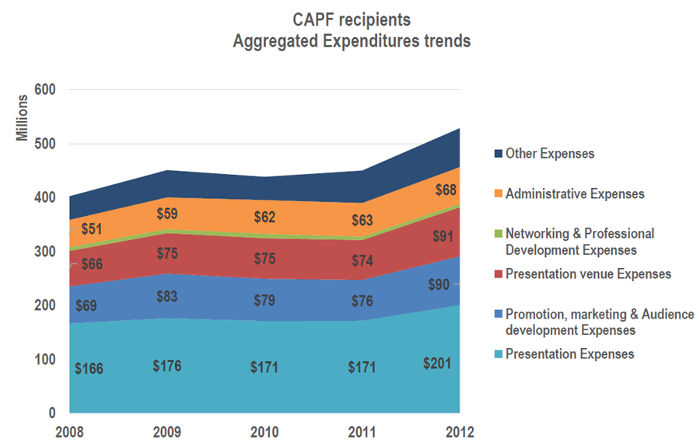
Over time, aggregate revenues of CAPF recipients (N=600 per year) saw a nominal increase from $410 to $522 million between 2008-09 and 2012-13, for an average of $456 million per year. Over the same period, aggregate expenses of CAPF recipients saw a slightly greater increase from $400 to $530, for an average of $455 million per year. 2011-2012 is the only fiscal year during which total expenses were greater than total revenues. Both revenues and expenses have increased in 2012-13 after remaining relatively stable over the period of 2009-10 to 2011-12. This stagnation could be an indication of the impact of the economic downturn. However, revenues and expenses in 2010-11 and 2011-12 are higher than any previous fiscal year, except 2009-10. This could suggest that CAPF recipients have been rather resilient during the economic downturn. Interestingly, public revenues saw more fluctuation in 2010 and 2011 than private and earned revenues. On the expenses side, presentation expenses held relatively steady, averaging $177.5 million over the five-year period (close to 40% of total expenses).
Over a ten-year outlook (not shown in chart), in relative terms, most expense types have held steady except Promotion, marketing and audience development expenses, as well as Other expenses. Between 2003-2005 and 2010-2012 (3-year averages are used to even out annual variations), expenses allocated to Promotion, marketing and audience development decreased from 21% to 17% of total expenditures, while Other expenses increased from 9% to 12% of total expenditures.
The CAPF financial data is not comparable with the financial information collected in the Survey of Presenters due to methodological differences.
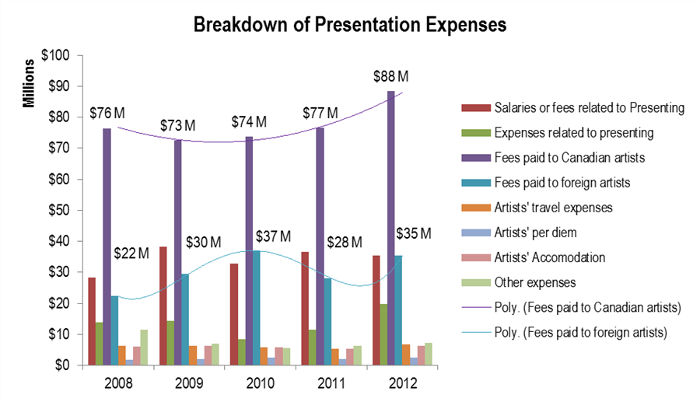
Fees paid to artists
The breakdown of presentation expenses by CAPF recipients provides useful information on fees paid to artists, and this information is comparable with data collected in the Survey of Presenters.
Respondents to the Survey of Presenters paid on average artistic fees in the amount of $131,500 for the year that preceded the survey (2011). Data collected by Canadian Heritage for the same period (using a three-year average to even out annual variation) indicates that CAPF clients paid on average artistic fees in the amount of $177,000. Using these two datasets, it is possible to estimate that 1,400 Canadian presenters (the total number of organizations in the sampling database for the Survey of Presenters) paid $212 million in artist fees in 2010 (this figure should be used with caution – the two datasets are not fully comparable and no margin of error can be associated with either). This includes fees to both Canadian artists and foreign artists.
Taking a closer look at CAPF presentation expenses over the 2008-2012 period, direct fees paid to artists averaged $107.9 million. Of these, $77.5 million were paid to Canadian artists annually and $30.4 million to foreign artists. Fees to Canadian artists represent 49% of total presentation expenses and 19% of all CAPF recipients’ expenses. In total, artists fees (Canadian and foreign) represent around 27% of all CAPF recipients aggregate expenses.
Attendance
The total attendance reported by CAPF clients is impressive: it can be estimated at more than 20 million attendees per year. This includes both ticketed and paid attendance for series presenters and festivals and is a yearly average for the period 2008-2012. This figure must be interpreted with caution. Firstly, it represents cumulative attendance: people who attended more than once are counted several times. Secondly, attendance at free, non- ticketed events can sometimes not be accurately measured. Thirdly, there is a risk of bias since this information is provided as part of a funder-client relationship and cannot be verified in the same way as audited financial statements.
There is considerable variation among individual clients and between fiscal years. It is not possible to draw any conclusion from the fluctuation between fiscal years.
There is also a significant difference between the average attendances reported by CAPF clients and Survey of Presenters respondents. The CAPF average attendance for the 2010-2011 fiscal year is 60% greater than the Survey of Presenters average attendance. CAPF data includes clients that present large festivals, which may contribute to the difference with the Survey of Presenters data.
Conclusion and Next Steps
Canadian Heritage and CAPACOA will continue the dialogue on data collection in the presenting sector. By publishing this brief report, we are hoping that CAPF clients will have a greater awareness of the importance of their financial and statistical information.
We also look forward to the positive outcomes of the modernization of grants and contributions administration at Canadian Heritage. As the department implements online application and reporting (85% should be online by 2017), we will be able to access data in a more timely fashion and we will benefit from a greater completion rate on final reporting.
Published: November 10, 2015