The recovery of the live performance sector continued during the third quarter of 2022. Inflationary pressures on household spendings hampered GDP growth, but the sector nonetheless performed better than most other cultural sectors and than the Canadian economy as a whole. The nominal gross domestic product (GDP) for the live performance domain increased 2.8% during the second quarter of 2022, reaching $727 million. Employment increased 5.3%, to 71,200 jobs.
Modest GDP growth although faster than Canadian economy
Looking at real GDP, which takes inflation into account, the live performance domain increased 2.1% in the second quarter of 2022. This was more than the growth of culture GDP (1.5%), and the Canadian economy as a whole (0.7%).
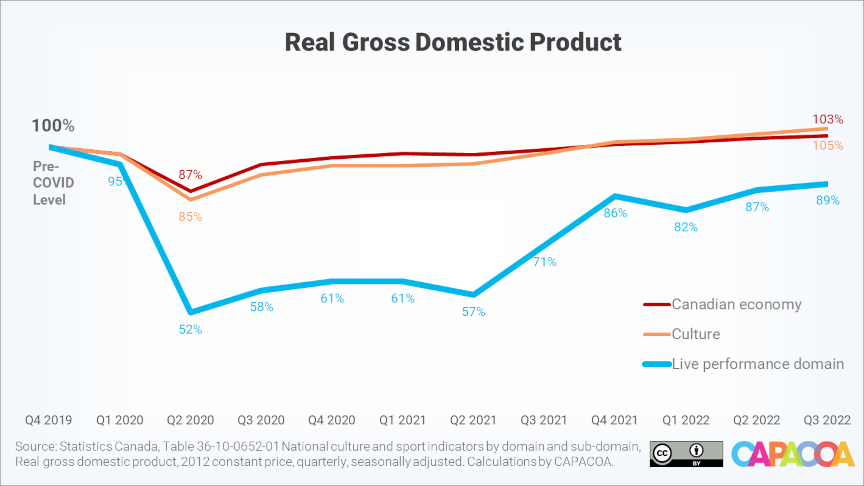
There has been data correction since the last release of the National Culture Indicators. Whereas the last release estimated that the Live Performance domain was 8.8% away from a full recovery in the second quarter of 2022, it turns out it was in fact 12.6% away. With the 2.1% increase between the second and the third quarter of 2022, the live performance domain is now 10.7% away from a full recovery.
When will there be a “full recovery”? The economic forecasts for 2023 are not much better than in 2022. Inflation stays high (5.9% in January 2023) and many economists anticipate an economic slow down in 2023. In these conditions, Canadian households will continue to have limited disposable income to buy tickets to a show or attend a festival.
Steady employment growth
Employment in the live performance domain closed the gap to recovery by another 4.9 percentage point. This was the fifth consecutive quarterly increase. At 71,246, it is now 3.9% away from its pre-covid level.
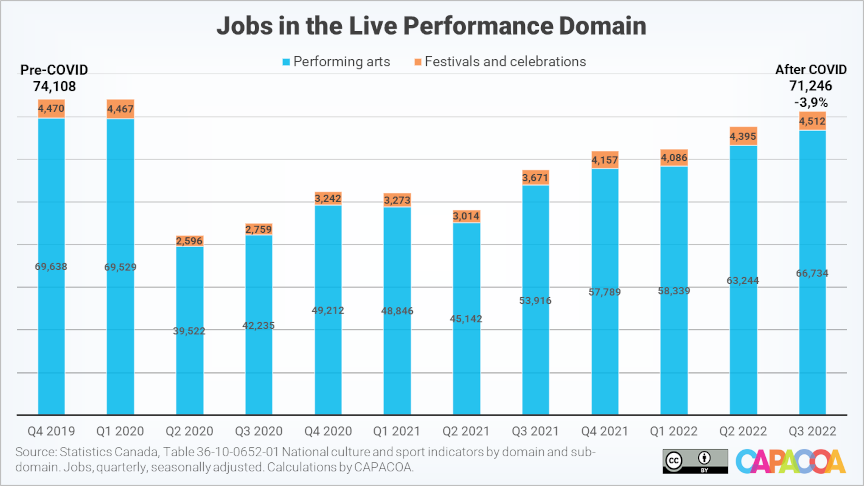
In spite of this steady growth, the sector continues to experience shortages in a few areas, notably in technical labour. This has driven compensation upwards by at least 30%, according to Quebec festivals.
Data animation
The above presentation shows quarterly fluctuations of real gross domestic product in each of the nine culture domains. The real GDP levels in the fourth quarter of 2019 are used as the baseline to calculate indices for each domain.
Data tables
Real gross domestic product (x 1,000) by domain of culture
| Domain | Q4 2019 | Q2 2022 | Compared to pre-COVID (%) |
|---|---|---|---|
| Culture total | 13,599,011 | 14,334,356 | 5.4% |
| Heritage and libraries | 172,229 | 149,778 | -13.0% |
| Live performance | 669,870 | 598,023 | -10.7% |
| Visual and applied arts | 2,685,078 | 2,878,684 | 7.2% |
| Written and published works | 1,776,264 | 1,568,525 | -11.7% |
| Audio-visual and interactive media | 5,247,411 | 5,806,606 | 10.7% |
| Sound recording | 155,608 | 163,444 | 5.0% |
| Education and training | 780,076 | 838,230 | 7.5% |
| Governance, funding and professional support | 1,860,699 | 2,058,350 | 10.6% |
| Multi domain | 251,775 | 272,716 | 8.3% |
Jobs by domain of culture
| Domain | Q4 2019 | Q3 2022 | Compared to pre-COVID | Compared to pre-COVID (%) |
|---|---|---|---|---|
| Culture total | 679,040 | 710,477 | 31,437 | 4.6% |
| Heritage and libraries | 18,612 | 17,251 | -1,361 | -7.3% |
| Live performance | 74,108 | 71,246 | -2,862 | -3.9% |
| Visual and applied arts | 147,002 | 160,240 | 13,238 | 9.0% |
| Written and published works | 104,437 | 91,956 | -12,481 | -12.0% |
| Audio-visual and interactive media | 175,544 | 201,931 | 26,387 | 15.0% |
| Sound recording | 7,717 | 7,465 | -252 | -3.3% |
| Education and training | 53,880 | 56,498 | 2,618 | 4.9% |
| Governance, funding and professional support | 87,558 | 93,030 | 5,472 | 6.2% |
| Multi domain | 10,182 | 10,861 | 679 | 6.7% |
More information
The National Culture Indicators in The Daily
National Culture Indicators for the second quarter of 2022
About the National Culture Indicators
- Data revisions: Economic estimates are regularly revised by Statististics Canada. Data for previous quarters may differ with data reported in our previous analyses.
- The National Culture Indicators (NCI) provide timely and detailed economic statistics about the culture sector. The NCI are an extension of the Culture Satellite Account. They were developed by the Culture Statistics Strategy Consortium, of which CAPACOA is an active member. Before the NCI, CAPACOA used to rely on the Labour Force Survey to monitor employment in the arts sector.
- Gross domestic product (GDP) is a measure of economic activity, defined as the total value of final goods and services produced within the limits of a given geographic area during a given time period.
- Culture GDP is the value added related to the production of culture goods and services across the economy, regardless of the producing industry.
- Real GDP figures are in constant 2012 dollars – they take inflation into account. Nominal GDP figures are in current dollars.
- Culture jobs are the number of jobs that are related to the production of culture goods and services.
- Culture is dominated by large seasonal fluctuations exhibiting similar patterns from one year to the next. For the convenience of users, these regular variations are removed from the NCI, through a statistical technique known as seasonal adjustment, to help isolate underlying trends.
- Culture Satellite Account statistics are grouped by domains and subdomains. The definitions of culture domains and subdomains can be found in the Conceptual Framework for Culture Statistics 2011. Mapping between culture domains and the North American Industry Classification System can be found in the Classification Guide for the Canadian Framework for Culture Statistics 2011.
Prepared by: Frédéric Julien, Director of Research and Development, CAPACOA.