Employment declined in most industries in December, including the arts sector and in cultural industries in December 2020.
Total hours worked in the arts, entertainment and recreation sector [NAICS 71] declined for the fourth straight month, down 4.1% in December.
In order to provide a detailed picture of job losses in the arts, culture and heritage sub-sectors during the COVID-19 crisis, CAPACOA licenced access to custom employment statistics from Statistics Canada. These statistics are from the Labour Force Survey, a monthly survey of approximately 56,000 households. They provide an account of employment for full-time, part-time and occasional employees, as well as self-employed workers.
Focus on actual hours worked
- While employment was down 0.6% across all industries in December, total actual hours worked increased 3.4%. Yet, they were down 4.3% compared to pre-COVID level, that is last year at the same period.
- Five sectors were still more than 10% away from recovery (see table 3.B, below):
- Transportation and warehousing: -11.8%
- Business, building and other support services: -14.7%
- Other services (except public services): -16.2%
- Accommodation and food services: -33.5%
- Arts, entertainment and recreation: -39.4%
- Total hours worked in the arts, entertainment and recreation sector [71] declined for the fourth straight month, down 4.1% in December.
- The performing arts, spectator sports and related industries [711] displayed an unusual 8.4% increase in December. However, this data point should be interpreted with caution, since the increase is driven by industry groups whose data is no longer reliable enough to be released.

Other employment indicators
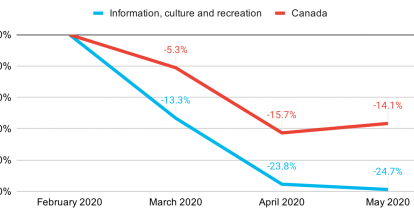
- For the first time in four months, employment decreased in information and cultural industries [51]. It was down 8.3% in December. Total employment in this sector nonetheless remained 14% higher than in 2019 at the same period.
- Employment fell for the fourth consecutive month in the arts, entertainment and recreation sector [71] in December, this time by 3.7%.
- The arts, entertainment and recreation sector [71] remains the furthest away from recovery. Total employment was 31.9% lower than last year at the same period. In comparison, accommodation and food services were 26.9% away from recovery.
- Total labour force participation decreased slightly in both the information and cultural industries [51] (-1.5%) and the arts, entertainment and recreation sector [71] (-0.7%).
Table 1 – Labour force estimates (x 1,000) by selected industry, Canada, unadjusted for seasonality
| Industry (with NAICS classification) | Labour force, Dec. 2020 (x 1,000) | c. previous month (x1,000) | c. previous month (%) | Dec. 2020 c. Dec. 2019 (x 1,000) | Dec. 2020 c. Dec. 2019 (%) |
|---|---|---|---|---|---|
| Total, all industries | 20108.4 | -121.4 | -0.6% | -21 | -0.1% |
| 51, 71 Information, culture and recreation 1 | 723 | -8.4 | -1.1% | -49.2 | -6.4% |
| 51 Information and cultural industries | 381.7 | -6 | -1.5% | 49.9 | 15.0% |
| 511 Publishing industries (except internet) | 73.4 | 7.4 | 11.2% | 6.5 | 9.7% |
| 512 Motion picture and sound recording industries | 93.2 | -1.5 | -1.6% | 10 | 12.0% |
| 515 Broadcasting (except internet) 2 | 30.5 | -5 | -14.1% | -5.8 | -16.0% |
| 517 Telecommunications | 134.9 | -15 | -10.0% | 35.8 | 36.1% |
| 518 Data processing, hosting, and related services 3 | 8.6 | 1.5 | 21.1% | -4.7 | -35.3% |
| 519 Other information services 2 | 41 | 6.5 | 18.8% | 8.1 | 24.6% |
| 71 Arts, entertainment and recreation | 341.3 | -2.4 | -0.7% | -99.1 | -22.5% |
| 711 Performing arts, spectator sports and related industries | 116.4 | 6.3 | 5.7% | -30.3 | -20.7% |
| 7111 Performing arts companies 2 | 18.9 | 5.3 | 39.0% | -20.8 | -52.4% |
| 7112 Spectator sports 2 | 6.7 | 0.4 | 6.3% | -7 | -51.1% |
| 7113 Promoters (presenters) of performing arts, sports and similar events 3 | x | x | x | x | x |
| 7114 Agents and managers for artists, athletes, entertainers and other public figures 3 | x | x | x | x | x |
| 7115 Independent artists, writers and performers | 73.7 | -2.8 | -3.7% | -2.6 | -3.4% |
| 712 Heritage institutions | 33.9 | 4.1 | 13.8% | 3 | 9.7% |
| 713 Amusement, gambling and recreation industries | 190.9 | -12.9 | -6.3% | -72 | -27.4% |
Table 2 – Employment estimates (x 1,000), by selected industries, Canada, unadjusted for seasonality
| Industry (with NAICS classification) | Employment, Dec. 2020 (x 1,000) | c. previous month (x1,000) | c. previous month (%) | Dec. 2020 c. Dec. 2019 (x 1,000) | Dec. 2020 c. Dec. 2019 (%) |
|---|---|---|---|---|---|
| Total, all industries | 18503.2 | -113.9 | -0.6% | -593.2 | -3.1% |
| 51, 71 Information, culture and recreation 1 | 644.2 | -19.1 | -2.9% | -86.9 | -11.9% |
| 51 Information and cultural industries | 363.2 | -8.4 | -2.3% | 44.5 | 14.0% |
| 511 Publishing industries (except internet) | 71 | 6.6 | 10.2% | 6.9 | 10.8% |
| 512 Motion picture and sound recording industries | 83.2 | -5.5 | -6.2% | 9.5 | 12.9% |
| 515 Broadcasting (except internet) | 27.3 | -7.4 | -21.3% | -8.8 | -24.4% |
| 517 Telecommunications | 132.5 | -12.8 | -8.8% | 33.9 | 34.4% |
| 518 Data processing, hosting, and related services 2 | 8.6 | 1.5 | 21.1% | -4.7 | -35.3% |
| 519 Other information services | 40.6 | 9.1 | 28.9% | 7.7 | 23.4% |
| 71 Arts, entertainment and recreation | 281 | -10.7 | -3.7% | -131.4 | -31.9% |
| 711 Performing arts, spectator sports and related industries | 104.6 | 4.4 | 4.4% | -37.2 | -26.2% |
| 7111 Performing arts companies 2 | 14.8 | 3.1 | 26.5% | -24.5 | -62.3% |
| 7112 Spectator sports 2 | 4.5 | -1.3 | -22.4% | -8 | -64.0% |
| 7113 Promoters (presenters) of performing arts, sports and similar events 3 | x | x | x | x | x |
| 7114 Agents and managers for artists, athletes, entertainers and other public figures 3 | x | x | x | x | x |
| 7115 Independent artists, writers and performers | 69.7 | -1.8 | -2.5% | -5.5 | -7.3% |
| 712 Heritage institutions | 28 | 1.4 | 5.3% | -0.7 | -2.4% |
| 713 Amusement, gambling and recreation industries | 148.4 | -16.5 | -10.0% | -93.6 | -38.7% |
Table 3.A – Total actual hours worked estimates (x 1,000), arts and culture industries, Canada, unadjusted for seasonality
| Industry (with NAICS classification) | Total actual hours (x 1,000), Dec. 2020 | c. previous month (%) | Dec. 2020 c. Dec. 2019 (%) |
|---|---|---|---|
| Total, all industries | 605956 | 3.4% | -4.3% |
| 51, 71 Information, culture and recreation 1 | 19853.4 | 1.2% | -8.0% |
| 51 Information and cultural industries | 13329.3 | 4.0% | 23.2% |
| 511 Publishing industries (except internet) | 2640.5 | 23.3% | 20.0% |
| 512 Motion picture and sound recording industries | 3376.7 | 8.4% | 39.0% |
| 515 Broadcasting (except internet) 2 | 1044.9 | -16.5% | -11.1% |
| 517 Telecommunications | 4761.6 | -8.6% | 30.4% |
| 518 Data processing, hosting, and related services 3 | 319.2 | 36.9% | -35.7% |
| 519 Other information services 2 | 1186.4 | 37.4% | 37.7% |
| 71 Arts, entertainment and recreation | 6524.1 | -4.1% | -39.4% |
| 711 Performing arts, spectator sports and related industries | 2362.4 | 8.5% | -35.5% |
| 7111 Performing arts companies 3 | x | x | x |
| 7112 Spectator sports 3 | x | x | x |
| 7113 Promoters (presenters) of performing arts, sports and similar events 3 | x | x | x |
| 7114 Agents and managers for artists, athletes, entertainers and other public figures 3 | x | x | x |
| 7115 Independent artists, writers and performers | 1469.1 | 1.7% | -17.3% |
| 712 Heritage institutions 2 | 880.5 | 10.7% | -6.1% |
| 713 Amusement, gambling and recreation industries | 3281.2 | -14.3% | -46.8% |
Table 3.B – Total actual hours worked estimates (x 1,000), other industries, Canada, unadjusted for seasonality
| Industry (with NAICS classification) | Total actual hours (x 1,000), Dec. 2020 | c. previous month (%) | Dec. 2020 c. Dec. 2019 (%) |
|---|---|---|---|
| Total employed, all industries | 605956 | 3.4% | -4.3% |
| Agriculture | 10014.3 | -11.2% | -6.2% |
| Forestry, fishing, mining, quarrying, oil and gas | 12648.6 | 4.1% | -2.4% |
| Utilities | 5383.7 | 10.4% | 7.1% |
| Construction | 50428.3 | -0.6% | -6.8% |
| Manufacturing | 64096.5 | 4.0% | -0.3% |
| Wholesale and retail trade | 88409.7 | 4.2% | -3.7% |
| Transportation and warehousing | 34654.5 | 4.4% | -11.8% |
| Finance, insurance, real estate, rental and leasing | 43383.2 | 7.5% | 1.4% |
| Professional, scientific and technical services | 57055.5 | 5.5% | 4.3% |
| Business, building and other support services | 19382.3 | -2.9% | -14.6% |
| Educational services | 45560.1 | 7.2% | 3.2% |
| Health care and social assistance | 76496.4 | 3.9% | -0.2% |
| Information, culture and recreation | 19853.5 | 1.2% | -8.0% |
| Accommodation and food services | 21728.4 | -7.1% | -33.5% |
| Other services (except public administration) | 22266.3 | -1.9% | -16.2% |
| Public administration | 34594.7 | 12.2% | 4.0% |
Notes
- This series aggregates two distinct sectors. Statistics Canada aggregates culture industries in such a way in order to ensure data quality at small geographic levels. This aggregated series is included in order to enable some degree of comparisons with data tables published by Statistics Canada. The aggregation was performed by CAPACOA and no coefficient of variation for this series was provided by Statistics Canada. However, the aggregated data is presumed to be reliable because the coefficient of variation for each sector is very low.
- The sample for this series is small. Month-to-month variations in this series should be interpreted with caution.
- The sample for this series is very small. Data is unreliable and unsuited for release.
Additional notes about the Labour Force Survey
- “Labour force” estimates are the number of persons 15 years of age and over who, during the reference week, were employed or unemployed. “Unemployed” means persons who were without work, had looked for work in the past four weeks, and were available for work. Unemployed persons retain the NAICS industry classification of their previous job.
- “Employment” includes full-time, part-time and occasional employees, as well as self-employed workers who worked during the reference week, no matter how many hours. Certain sub-sectors that include a large proportion of self-employed workers, for example, independent artists may therefore not show a significant drop because those freelance workers may still have been considered “working”.
- “Total actual hours worked” is a good indicator of the impacts of COVID-related restrictions on the labour force, because it offers an account of both the number of employed workers and the hours they worked. It is a particularly relevant indicator for sub-sectors that include a lot of freelance and occasional workers (and who may be deemed as “employed” even if they only worked a few hours during the reference period).
- These statistics are not adjusted for seasonality (whereas many Statistics Canada tables are). Many culture industries are subject to significant seasonal variations. In order to have a fair estimation of employment change compared to pre-COVID level, it is therefore preferable to establish comparisons with the same period in 2019 rather than with February 2020.
- The “711 Performing arts, spectator sports and related industries” sub-sector is a larger industry grouping than the “Live Performance” domain used in the Culture Satellite Account, but it is a fair proxy that can be tracked over time. The 711 sub-sector involves activities that aren’t part of the live performance domain such as 7112 Spectator sports, as well as parts of 7113, 7114 and 7115. Definitions for each industry group are available in the North American Industry Classification System 2017. More details on the mapping between NAICS 711 and the live performance domain can be found in the Classification Guide for the Canadian Framework for Culture Statistics 2011.
- Equivalent employment statistics for other sectors of the Canadian economy can be found in Table 14-10-0022-01 Labour force characteristics by industry, monthly, unadjusted for seasonality and in Table 14-10-0036-01 Actual hours worked by industry, monthly, unadjusted for seasonality.
More information
More statistics from the Labour Force Survey in The Daily
Employment in arts and culture industries, November 2020
Prepared by: Frédéric Julien, Director of Research and Development.