The nominal gross domestic product (GDP) for the live performance domain increased 1.8% during the first quarter of 2022, reaching $698 million. Employment increased 4.9%, to 65,000 jobs. These are relatively modest increases compared to the fast-pace recovery that the sector had experienced during the second half of 2021. This slowing down of GDP growth in the live performance domain was likely consequential to the Omicron wave, which led to another round of government-mandated closures in January and February 2022.
Gross domestic product stalls
Taking inflation into account, the real GDP of the live performance domain increased 0.8% in the first quarter of 2022, compared to the last quarter of 2021. This minor fluctuation parallels the Canadian economy, whose real GDP also grew 0.8% during the same period. The culture GDP saw a 1.4% increase, driven mainly by the visual and applied arts and the sound recording domains (2.4% each).
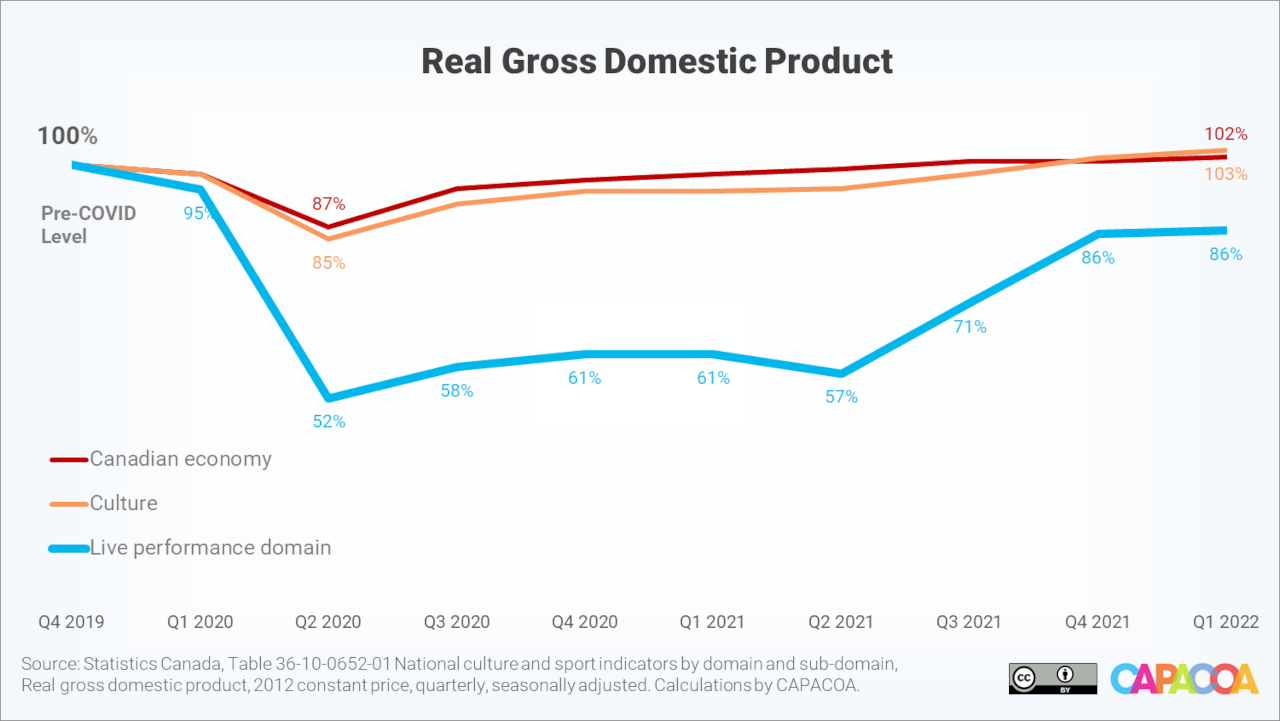
While the Canadian economy and the culture sector as a whole have now fully recovered from the pandemic, the live performance domain sat at 13.6% below its pre-pandemic real GDP level during the first quarter of 2022.
Note: Data for the National Culture Indicators was revised by Statistics Canada (see below). As a result of this revision, data points in this analysis differ from data points in our previous publications.
Job growth continues steadily
The live performance domain didn’t seem too significantly affected by labour force shortages. The sector gained 3,027 jobs during the first quarter of 2022, reaching 64,973 jobs. This represented a 4.9% increase compared to a 1.3% increase across the culture sector. This relatively good performance of the live performance domain could be attributed in part to the sector-specific interventions of the federal government. Funding for “Supporting Workers in the Live Events and Arts Sectors” was delivered throughout the 2021-2022 fiscal year “to help provide work opportunities for artists and cultural workers”. Between the first and the last quarter of that fiscal year, the live performance domain saw cumulative increases of 16,897 jobs. This represented a 22.7 percentage point increase compared to pre-pandemic employment levels.
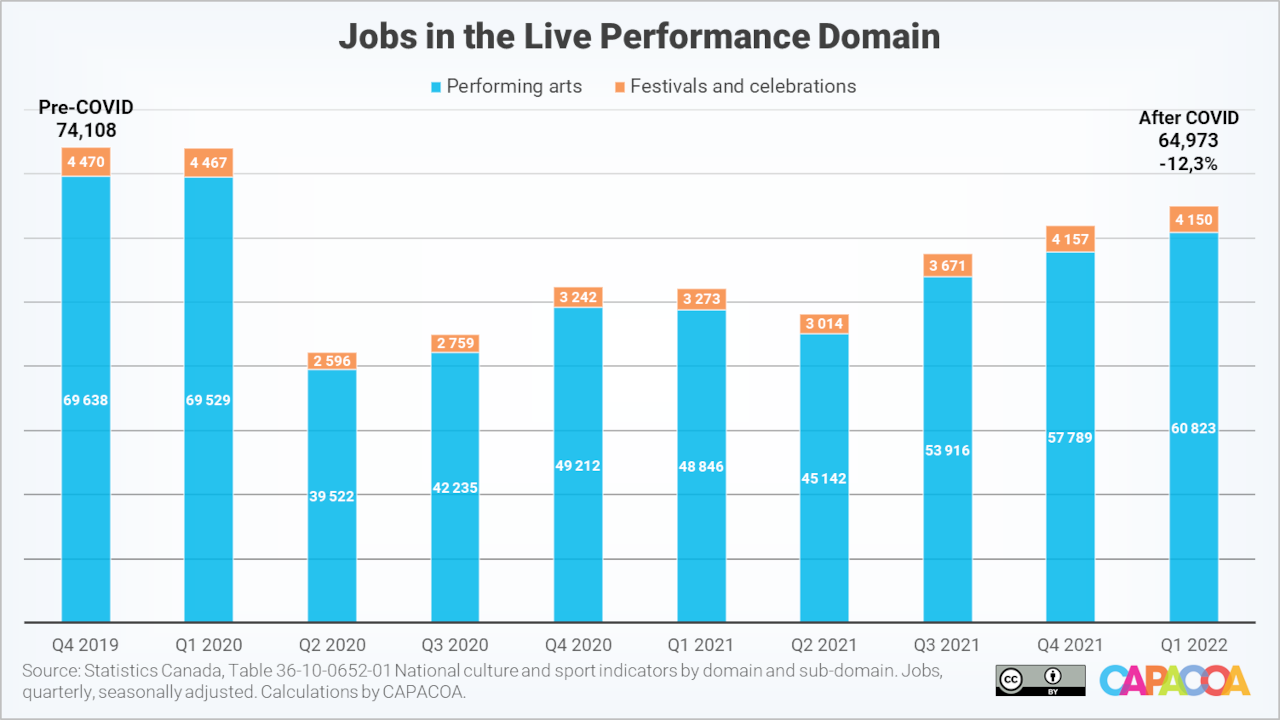
Compared to the last quarter of 2019, employment in the live performance domain is now 12.3% below its pre-pandemic level.
Data animation
The above presentation shows quarterly fluctuations of real gross domestic product in each of the nine culture domains. The real GDP levels in the fourth quarter of 2019 are used as the baseline to calculate indices for each domain.
Data tables
Real gross domestic product (x 1,000) by domain of culture
| Domain | Q4 2019 | Q1 2022 | Variation (%) |
|---|---|---|---|
| Culture total | 13,599,011 | 14,001,414 | 3.0% |
| Heritage and libraries | 172,229 | 141,819 | -17.7% |
| Live performance | 669,870 | 578,878 | -13.6% |
| Visual and applied arts | 2,685,078 | 2,793,952 | 4.1% |
| Written and published works | 1,776,264 | 1,553,897 | -12.5% |
| Audio-visual and interactive media | 5,247,411 | 5,696,199 | 8.6% |
| Sound recording | 155,608 | 163,948 | 5.4% |
| Education and training | 780,076 | 820,124 | 5.1% |
| Governance, funding and professional support | 1,860,699 | 1,985,716 | 6.7% |
| Multi domain | 251,775 | 266,881 | 6.0% |
Jobs by domain of culture
| Domain | Q4 2019 | Q1 2022 | Variation | Variation (%) |
|---|---|---|---|---|
| Culture total | 679,040 | 677,448 | -1,592 | -0.2% |
| Heritage and libraries | 18,612 | 16,026 | -2,586 | -13.9% |
| Live performance | 74,108 | 64,973 | -9,135 | -12.3% |
| Visual and applied arts | 147,002 | 155,221 | 8,219 | 5.6% |
| Written and published works | 104,437 | 91,057 | -13,380 | -12.8% |
| Audio-visual and interactive media | 175,544 | 188,537 | 12,993 | 7.4% |
| Sound recording | 7,717 | 7,401 | -316 | -4.1% |
| Education and training | 53,880 | 54,144 | 264 | 0.5% |
| Governance, funding and professional support | 87,558 | 89,586 | 2,028 | 2.3% |
| Multi domain | 10,182 | 10,504 | 322 | 3.2% |
More information
The National Culture Indicators in The Daily
National Culture Indicators for the fourth quarter of 2021
About the National Culture Indicators
- Data revisions: Data for the first quarter of 2018 to the fourth quarter of 2021 have been revised by Statistics Canada. Figures in this analysis may therefore not align with previous analyses.
- The National Culture Indicators (NCI) provide timely and detailed economic statistics about the culture sector. The NCI are an extension of the Culture Satellite Account. They were developed by the Culture Statistics Strategy Consortium, of which CAPACOA is an active member. Before the NCI, CAPACOA used to rely on the Labour Force Survey to monitor employment in the arts sector.
- Gross domestic product (GDP) is a measure of economic activity, defined as the total value of final goods and services produced within the limits of a given geographic area during a given time period.
- Culture GDP is the value added related to the production of culture goods and services across the economy, regardless of the producing industry.
- Real GDP figures are in constant 2012 dollars – they take inflation into account. Nominal GDP figures are in current dollars.
- Culture jobs are the number of jobs that are related to the production of culture goods and services.
- Culture is dominated by large seasonal fluctuations exhibiting similar patterns from one year to the next. For the convenience of users, these regular variations are removed from the NCI, through a statistical technique known as seasonal adjustment, to help isolate underlying trends.
- Culture Satellite Account statistics are grouped by domains and subdomains. The definitions of culture domains and subdomains can be found in the Conceptual Framework for Culture Statistics 2011. Mapping between culture domains and the North American Industry Classification System can be found in the Classification Guide for the Canadian Framework for Culture Statistics 2011.
Prepared by: Frédéric Julien, Director of Research and Development, CAPACOA.