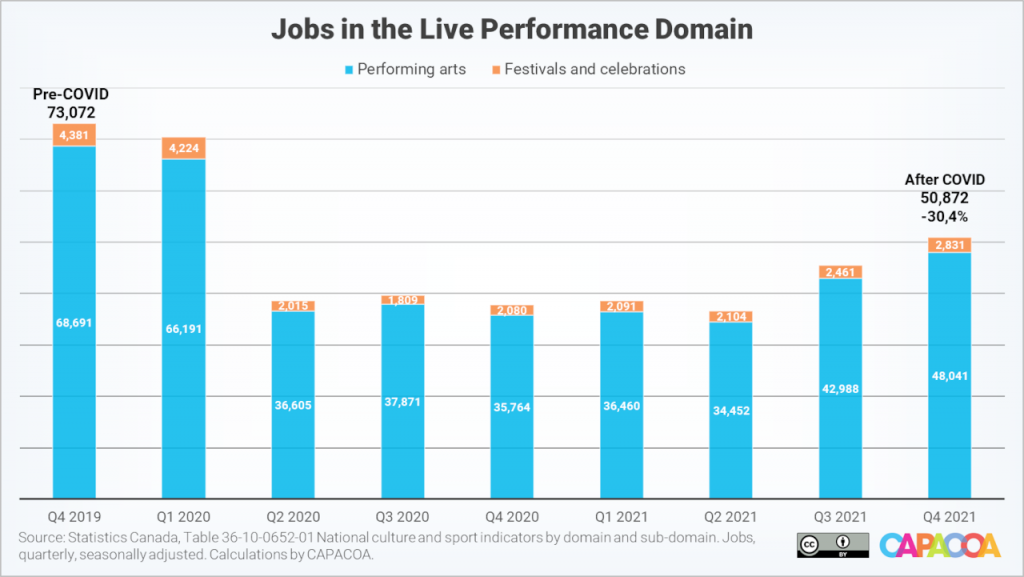
The nominal gross domestic product for the live performance domain increased 30.4% during the fourth quarter of 2021, reaching $468 million. This is the second consecutive increase for a sector that hadn’t seen any recovery at all up until last summer. The live performance domain also welcomed 5,423 workers back.
Not quite half-way through to full recovery
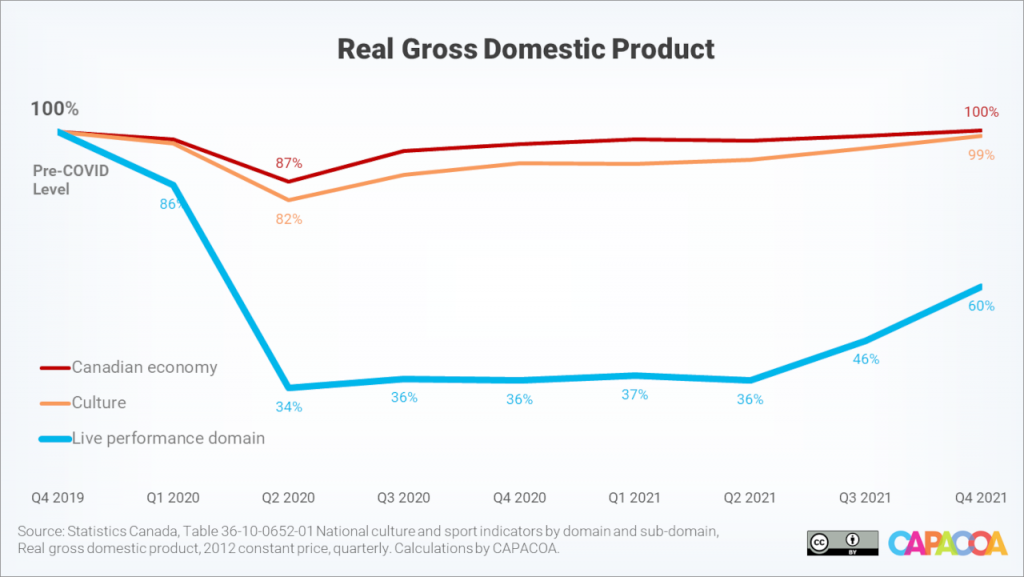
While these increases are significant, the live performance domain still has a long way to go to recovery. At the worst of the pandemic, during the second quarter of 2020, the live performance real GDP (taking inflation into account) was 66.2% lower than during the last quarter of 2019. With this second consecutive increase, the live performance real GDP is now 40.1% away from its pre-pandemic level.

On an annual basis, the live performance nominal GDP for 2021 was $1,393 million. This was less than in 2020, at $1,474 million, and considerably lower than in 2019, when it topped $3,031 million.
Another 5,400 artists and cultural managers got back to work
Employment didn’t grow quite as fast as GDP, but nonetheless continued on the upward trend initiated in the previous quarter. Employment in the live performance domain grew 11.9% in the last quarter of 2021, reaching 50,872 jobs. This represented a net increase of 5,423 jobs, on top of the 8,989 jobs gain registered in the previous quarter. Compared to the last quarter of 2019, employment in the live performance domain remains 30.4% below its pre-pandemic level.

Effective government interventions
The increases observed over the second half of 2021 coincided with the lifting of public health restrictions between the fourth and the fifth wave of the COVID pandemic. They also echoed the announcement and the rolling out of several sector-specific measures to support the hardest hit sector. A $181.5 million investment for “Supporting Workers in the Live Events and Arts Sectors” was first announced in the 2020 Fall Economic Statements, and details about the roll out of these project-based measures were announced in March 2021. The effect of these measures would have started to be felt on the ground a few months later, precisely when employment statistics rebounded.
What remains to be seen is if these measures, as well as subsequent announcements in the 2021 federal budget, will have helped the performance arts sector weather the Omicron wave, which led to another round of government-mandated restrictions and closures between December 2021 and February 2022. The National Culture Indicators for the first quarter of 2022 will be released in July – and CAPACOA’s analysis will be published shortly after.
Data tables
Real gross domestic product (x 1,000) by domain of culture
| Domain | Q4 2019 | Q4 2021 | Compared to pre-COVID (%) |
|---|---|---|---|
| Culture total | 12,922,044 | 12,782,912 | -1.1% |
| Heritage and libraries | 171,101 | 146,834 | -14.2% |
| Live performance | 663,840 | 397,866 | -40.1% |
| Visual and applied arts | 2,599,463 | 2,622,922 | 0.9% |
| Written and published works | 1,717,397 | 1,454,810 | -15.3% |
| Audio-visual and interactive media | 4,800,465 | 5,133,408 | 6.9% |
| Sound recording | 149,808 | 149,679 | -0.1% |
| Education and training | 765,158 | 779,844 | 1.9% |
| Governance, funding and professional support | 1,827,479 | 1,867,578 | 2.2% |
| Multi domain | 227,333 | 229,973 | 1.2% |
Jobs by domain of culture
| Domain | Q4 2019 | Q4 2021 | Compared to pre-COVID | Compared to pre-COVID (%) |
|---|---|---|---|---|
| Culture total | 678,275 | 661,479 | -16,796 | -2.5% |
| Heritage and libraries | 18,323 | 16,692 | -1,631 | -8.9% |
| Live performance | 73,072 | 50,872 | -22,200 | -30.4% |
| Visual and applied arts | 150,419 | 154,163 | 3,744 | 2.5% |
| Written and published works | 104,152 | 92,014 | -12,138 | -11.7% |
| Audio-visual and interactive media | 170,660 | 182,633 | 11,973 | 7.0% |
| Sound recording | 8,290 | 8,140 | -150 | -1.8% |
| Education and training | 55,118 | 56,904 | 1,786 | 3.2% |
| Governance, funding and professional support | 88,465 | 90,073 | 1,608 | 1.8% |
| Multi domain | 9,775 | 9,988 | 213 | 2.2% |
More information
The National Culture Indicators in The Daily
National Culture Indicators for the third quarter of 2021
About the National Culture Indicators
- The National Culture Indicators (NCI) provide timely and detailed economic statistics about the culture sector. The NCI are an extension of the Culture Satellite Account. They were developed by the Culture Statistics Strategy Consortium, of which CAPACOA is an active member. Before the NCI, CAPACOA used to rely on the Labour Force Survey to monitor employment in the arts sector.
- Gross domestic product (GDP) is a measure of economic activity, defined as the total value of final goods and services produced within the limits of a given geographic area during a given time period.
- Culture GDP is the value added related to the production of culture goods and services across the economy, regardless of the producing industry.
- Real GDP figures are in constant 2012 dollars – they take inflation into account. Nominal GDP figures are in current dollars.
- Culture jobs are the number of jobs that are related to the production of culture goods and services.
- Culture is dominated by large seasonal fluctuations exhibiting similar patterns from one year to the next. For the convenience of users, these regular variations are removed from the NCI, through a statistical technique known as seasonal adjustment, to help isolate underlying trends.
- Culture Satellite Account statistics are grouped by domains and subdomains. The definitions of culture domains and sub-domains can be found in the Conceptual Framework for Culture Statistics 2011. Mapping between culture domains and the North American Industry Classification System can be found in the Classification Guide for the Canadian Framework for Culture Statistics 2011.
Prepared by: Frédéric Julien, Director of Research and Development, CAPACOA.


