
With the loosening and lifting of public health restrictions on gathering during the third quarter of 2021, the live performance domain saw its first signs of a recovery. As a matter of fact, of all culture domains, it experienced the largest growth in gross domestic product (29,4%) and jobs (24,6%). In spite of these increases, the live performance domain still remains the furthest away from a full recovery.
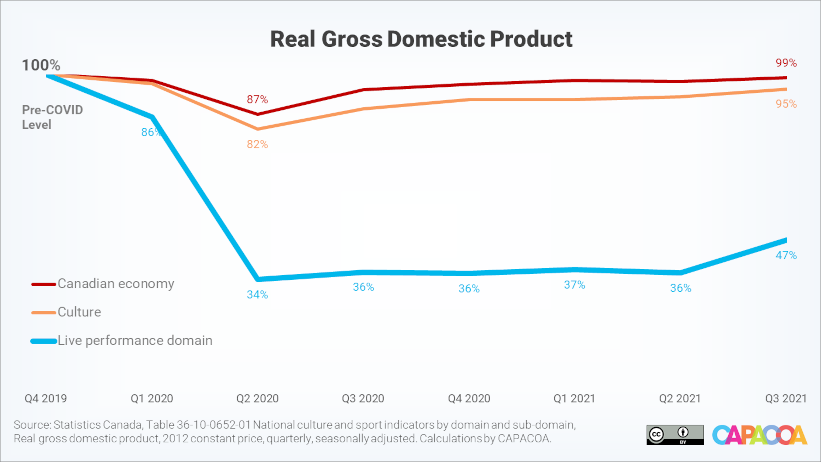
GDP rebounded
After 12 months of stagnation, the real GDP of the live performance domain increased 29,4% during the third quarter of 2021. It reached a nominal annualized value of $1,453 million. While this appears considerable, it is far less than the nominal GDP before the pandemic, in 2019: $3,030 million. In constant dollars (i.e. taking inflation into account), the live performance GDP was 53.4% away from its pre-pandemic level. In other words, the live performance domain has only closed roughly one fifth of the distance to its full recovery. Unsurprisingly, the live performance domain remains by far the hardest hit among all culture domains.
9,000 artists and cultural managers got back to work
After decreasing as low as 36,489 jobs in the second quarter of 2021, employment in the live performance domain rebounded 24.6% in the third quarter, gaining 8989 jobs. While this is a significant increase, employment remains 37.7% below its pre-pandemic level.
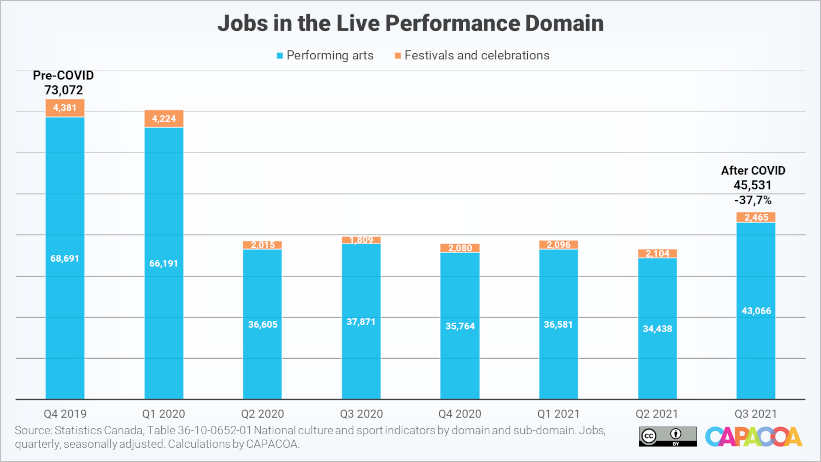
The live performance domain experienced the largest job growth of all culture domains in the third quarter of 2021. However, in spite of this increase it remains the furthest away from a full recovery.
Jobs by domain of culture
| Domain of culture | Fourth quarter of 2019 | Third quarter of 2021 | Compared to pre-COVID | Compared to pre-COVID (%) |
|---|---|---|---|---|
| Culture total | 678,275 | 632,310 | -45,965 | -6.8% |
| Heritage and libraries | 18,323 | 15,504 | -2,819 | -15.4% |
| Live performance | 73,072 | 45,531 | -27,541 | -37.7% |
| Visual and applied arts | 150,419 | 147,939 | -2,480 | -1.6% |
| Written and published works | 104,152 | 90,273 | -13,879 | -13.3% |
| Audio-visual and interactive media | 170,660 | 171,815 | 1,155 | 0.7% |
| Sound recording | 8,290 | 8,040 | -250 | -3.0% |
| Education and training | 55,118 | 54,784 | -334 | -0.6% |
| Governance, funding and professional support | 88,465 | 88,615 | 150 | 0.2% |
| Multi domain | 9,775 | 9,809 | 34 | 0.3% |
A snapshot (and a promise) of happier days
These statistics reflect the economic situation in the live performance domain before the Omicron wave began. With the return of public health restrictions in provinces and territories in December, we should anticipate a setback in the National Culture Indicators for the fourth quarter of 2021 and the first quarter of 2022. On the positive side of things, the newly reelected federal government seems intent on supporting the culture sector as long as needed for it to recover.
A few big questions remain. How much longer will that be? And in what shape will the live performance sector be when it is once again allowed to operate without restrictions?
More information
The National Culture Indicators in The Daily
About the National Culture Indicators
- The National Culture Indicators (NCI) provide timely and detailed economic statistics about the culture sector. The NCI are an extension of the Culture Satellite Account. They were developed by the Culture Statistics Strategy Consortium, of which CAPACOA is an active member. Before the NCI, CAPACOA used to rely on the Labour Force Survey to monitor employment in the arts sector.
- Culture GDP is the economic value added associated with culture activities. This is the value added related to the production of culture goods and services across the economy, regardless of the producing industry.
- Real GDP figures are in constant 2012 dollars – they take inflation into account. Nominal GDP figures are in current dollars.
- Culture jobs are the number of jobs that are related to the production of culture goods and services.
- Culture is dominated by large seasonal fluctuations exhibiting similar patterns from one year to the next. For the convenience of users, these regular variations are removed from the NCI, through a statistical technique known as seasonal adjustment, to help isolate underlying trends.
- Culture Satellite Account statistics are grouped by domains and subdomains. The definitions of culture domains and sub-domains can be found in the Conceptual Framework for Culture Statistics 2011. Mapping between culture domains and the North American Industry Classification System can be found in the Classification Guide for the Canadian Framework for Culture Statistics 2011.
Prepared by: Frédéric Julien, Director of Research and Development, CAPACOA.