Statistics Canada has now released the Labour Force Survey results for June 2020. A sharp recovery is observed across most industries. However, the arts sector appears to be lagging behind.
Statistics Canada’s analysis observes:
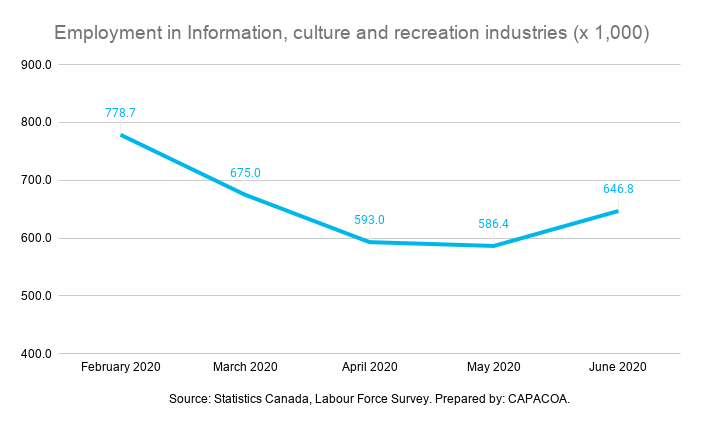
“The information, culture and recreation industry was subject to some of the earliest public health restrictions in the form of limitations on the size of gatherings, and all provinces continued to limit the number of people allowed to gather in public in June. While a notable increase in employment was observed in June (+60,000), employment in this industry was 83.1% of its pre-COVID level, the second-lowest proportion across all industries.”
Statistics Canada, Labour Force Survey, June 2020
Sorting out the mishmash
What is this “information, culture and recreation” industry, anyway?
It’s a combination of cultural industries and arts industries. The “information, culture and recreation industry” aggregates statistics from:
- “Information and cultural industries” (telecommunications, broadcasting, motion picture, sound recording, publishing, libraries, etc. [classification 51 in NAICS]);
- “Arts, entertainment and recreation” (performing arts, spectator sports, heritage institutions, gambling industries, etc. [classification 71 in NAICS]).
These industries involve different degrees of physical proximity between workers and with consumers. As such, they have felt the impact of the COVID-19 outbreak in different ways. These nuances are completely lost in the LFS.
The sum of the parts… hides contrasted realities
Back in April, the Canadian Survey on Business Conditions revealed that the arts, entertainment and recreation industry was one of the three most severely impacted industries on all survey indicators. Since then, another Statistics Canada publication confirmed the disparity in impact felt by different industries.
The Survey of Employment, Payrolls and Hours (SEPH), another Statistics Canada survey program, provides a monthly portrait of employment based on information returns and statistics provided by employers. The April edition of the SEPH reported:
“Heavy employment losses were recorded in the arts, entertainment and recreation sector, with employment falling by 141,700 (-45.0%) from February to April. This was largely due to losses in the amusement, gambling and recreation industries (-111,400 or -50.2%). A sharp decline was also observed in performing arts, spectator sports and related industries (-25,300 or -39.5%).”
Statistics Canada, Payroll employment, earnings and hours, April 2020
Compared to the 45.0% drop in the arts, entertainment and recreation sector, the information and cultural industries saw an 8.5% decline from February to April.
The following figure superposes the disaggregated statistics from the SEPH and the aggregated statistics from the LFS. The figure shows the sharp decline in employment for “arts, entertainment, and recreation”, as reported in the SEPH. This bleak reality is considerably softened when these industries are combined with others (such as telecommunications) under “information and culture” in the Labour Force Survey.

Forgotten freelance workers
The SEPH provides a useful level of granularity, but it only reports on payroll information provided by employers. Therefore, it misses out entirely on the large number of self-employed workers in the culture sector.
According to the 2016 census, 52% of artists are self-employed, compared with only 12% of all Canadian workers. And one third of all artists work within the “Arts, entertainment and recreation” industry.
These self-employed artists and other freelance cultural workers were among the first to be affected by public health restrictions on public gatherings, and they are anticipating a slow recovery. According to the I Lost My Gig Canada survey, they may lose as much as $25,000 in gig income over the year.
As the federal government extends the Canada Emergency Wage Subsidy, but announces no plan to further extend the Canada Emergency Response Benefit, one has to wonder: is the government really paying attention to these statistics?
Additional information
Here’s a comparative look at the LFS and the SEPH:
| Labour Force Survey | Survey of Payroll, Employment and Hours |
| Survey of Canadians | Survey of employers |
| Includes employed, self-employed and unemployed workers | Captures only employee data |
| Conducted monthly and published within a few weeks | Conducted monthly and published within two months |
| Lumps arts and cultural industries into an aggregated data series. | Provides more granularity |
CAPACOA wishes to acknowledge the exceptional output of Statistics Canada. In spite of COVID-related disruptions, our national statistics agency managed to hasten its data collection and dissemination of insights on the impacts of COVID-19 on businesses and individuals. To see for yourself, visit COVID-19: A data perspective.