According to the National Culture Indicators, real gross domestic product (GDP) for the culture sector in Canada increased 0.6% to $11.9 billion in the first quarter of 2021, compared with 1.4% for the total economy. However, some culture domains, such as live performance, are still very far from recovery.
These statistics are from the National Culture Indicators, a new program of the Culture Satellite Account designed to provide timely data on GDP and jobs in the culture sector.
The following charts and analysis are intended to supplement the high-level analysis provided by Statistics Canada. The charts focus on the live performance domain. Full data tables are available below (and on the Statistics Canada website).
Awaiting a recovery: real GDP outlook
While the Canadian economy as a whole almost fully recovered from the impact of the COVID-19 pandemic, the culture sector still lags behind. The live performance domain, which was hit harder than any other culture domain, saw a modest GDP gain of 3.7% during the first quarter of 2021. In spite of this gain, it remains at almost the same level as during the peak of the pandemic.

In the first quarter of 2021, the GDP of the live performing domain was still 62.9% below its pre-COVID level. This is much lower than in other culture domains, as the following chart attests.
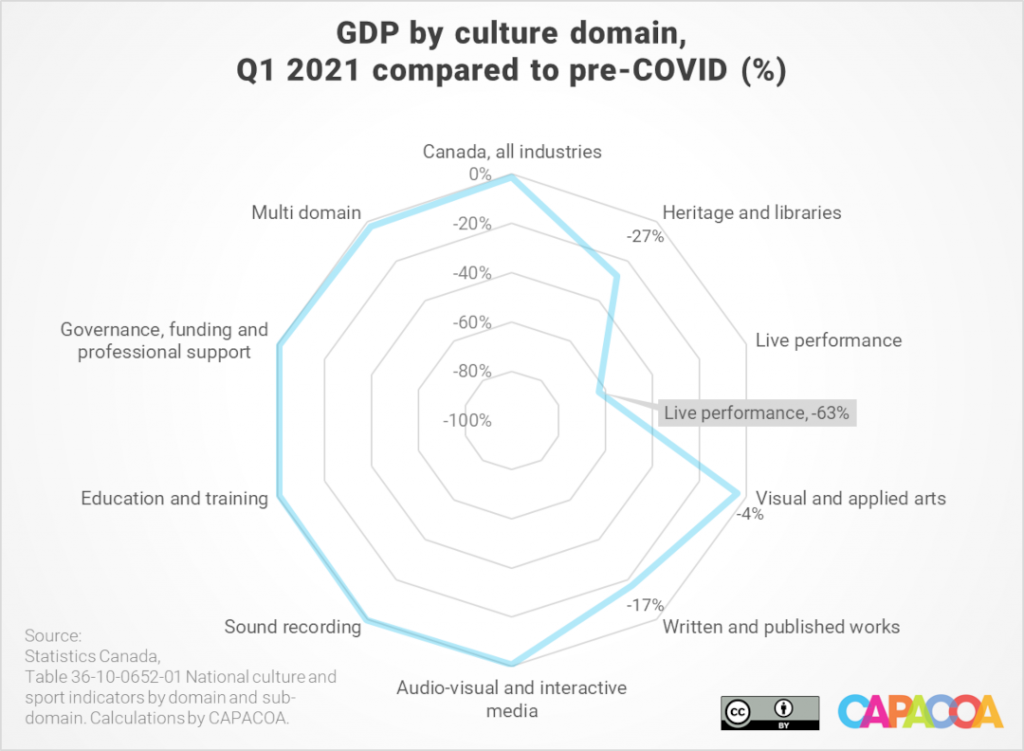
The National Culture Indicators are segmented by domain rather than by industry codes. They can, therefore, not be directly compared with GDP statistics by industry. A quick look at real GDP by industry nonetheless confirms that the arts sector was disproportionately affected compared to other sectors. During the first quarter of 2021, the real GDP of the arts, entertainment and recreation sector [NAICS 71] was 52.1% below its pre-COVID level. The second hardest hit industry is accommodation and food services [NAICS 72], at -35.9%.
Employment remains stable
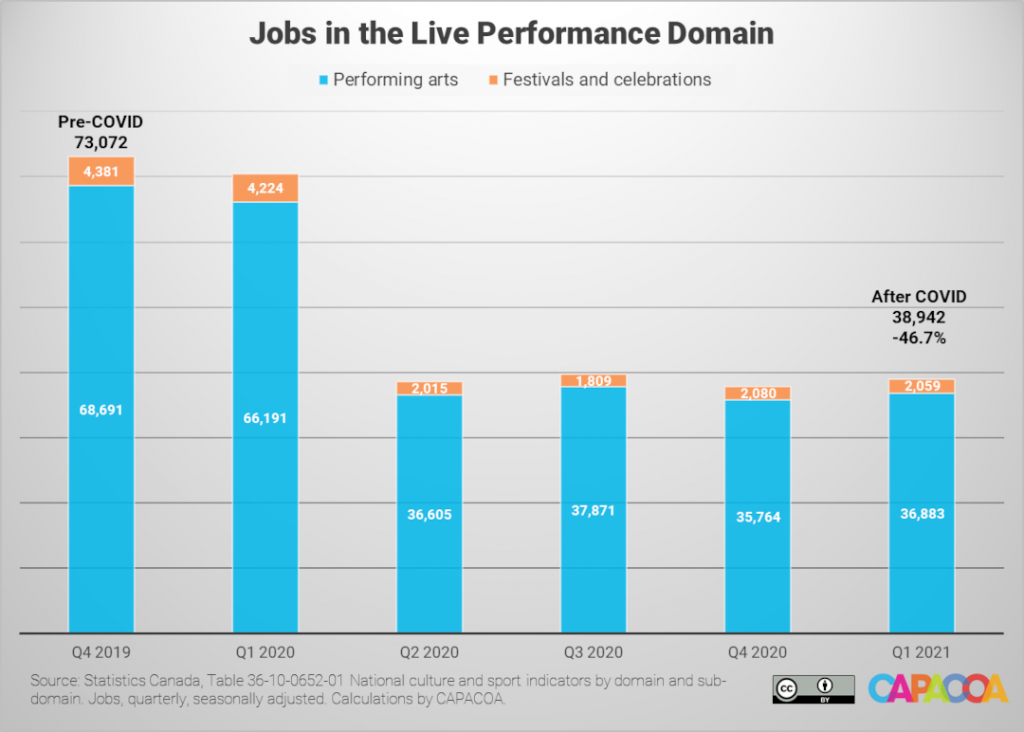
Thanks to a progressive easing of public health restrictions, the live performance domain recovered some of the jobs it had lost during the fourth quarter of 2020. 1,100 jobs were recovered during the first quarter of 2021 (+2,9%).
A year after the pandemic’s beginning, employment in the live performance domain sits roughly at the same level as during the second quarter of 2020: 46.7% away from recovery.
Complete data tables
Jobs variation between Q4 2019 and Q1 2021, by culture domain
| Domain Sub-domain | Q4 2019 | Q1 2021 | Compared to pre-COVID | Compared to pre-COVID (%) |
|---|---|---|---|---|
| Culture total | 678,275 | 603,482 | -74,793 | -11.0% |
| Heritage and libraries | 18,323 | 15,115 | -3,208 | -17.5% |
| Archives | 259 | 239 | -20 | -7.7% |
| Libraries | 1,084 | 1,007 | -77 | -7.1% |
| Culture heritage | 11,686 | 8,948 | -2,738 | -23.4% |
| Natural heritage | 5,294 | 4,921 | -373 | -7.0% |
| Live performance | 73,072 | 38,942 | -34,130 | -46.7% |
| Performing arts | 68,691 | 36,883 | -31,808 | -46.3% |
| Festivals and celebrations | 4,381 | 2,059 | -2,322 | -53.0% |
| Visual and applied arts | 150,419 | 142,931 | -7,488 | -5.0% |
| Original visual art | 2,587 | 2,075 | -512 | -19.8% |
| Art reproductions | 976 | 931 | -45 | -4.6% |
| Photography | 12,424 | 11,628 | -796 | -6.4% |
| Crafts | 33,073 | 31,489 | -1,584 | -4.8% |
| Advertising | 29,694 | 25,808 | -3,886 | -13.1% |
| Architecture | 16,175 | 15,720 | -455 | -2.8% |
| Design | 55,491 | 55,280 | -211 | -0.4% |
| Written and published works | 104,152 | 89,006 | -15,146 | -14.5% |
| Books | 9,539 | 8,816 | -723 | -7.6% |
| Periodicals | 9,195 | 7,932 | -1,263 | -13.7% |
| Newspapers | 20,761 | 17,565 | -3,196 | -15.4% |
| Other published works | 895 | 781 | -114 | -12.7% |
| Collected information | 4,457 | 3,977 | -480 | -10.8% |
| Multi sub-domain | 59,306 | 49,935 | -9,371 | -15.8% |
| Audio-visual and interactive media | 170,660 | 163,668 | -6,992 | -4.1% |
| Film and video | 74,278 | 66,621 | -7,657 | -10.3% |
| Broadcasting | 46,229 | 44,246 | -1,983 | -4.3% |
| Interactive media | 50,153 | 52,801 | 2,648 | 5.3% |
| Sound recording | 8,290 | 7,854 | -436 | -5.3% |
| Music publishing | 2,259 | 2,090 | -169 | -7.5% |
| Sound recording | 6,031 | 5,765 | -266 | -4.4% |
| Education and training | 55,118 | 52,914 | -2,204 | -4.0% |
| Governance, funding and professional support | 88,465 | 83,644 | -4,821 | -5.4% |
| Multi domain | 9,775 | 9,408 | -367 | -3.8% |
Real GDP variation between Q4 2019 and Q1 2021, by culture sub-domain (ordered from lowest to highest)
| Sub-domain | Q1 2021 compared to Q4 2019 (%) |
|---|---|
| Performing arts | -63.1% |
| Festivals and celebrations | -60.8% |
| Culture heritage | -36.3% |
| Newspapers | -24.5% |
| Original visual art | -23.7% |
| Natural heritage | -19.8% |
| Multi sub-domain | -19.8% |
| Periodicals | -19.7% |
| Other published works | -15.5% |
| Film and video | -11.6% |
| Advertising | -11.0% |
| Collected information | -9.2% |
| Books | -6.4% |
| Photography | -6.2% |
| Archives | -5.3% |
| Libraries | -4.5% |
| Crafts | -3.7% |
| Architecture | -3.1% |
| Broadcasting | -2.0% |
| Music publishing | 0.4% |
| Design | 0.7% |
| Sound recording | 1.5% |
| Interactive media | 8.1% |
| Art reproductions | 10.3% |
About the National Culture Indicators
- The National Culture Indicators (NCI) provide timely and detailed economic statistics about the culture sector. The NCI are an extension of the Culture Satellite Account. They were developed by the Culture Statistics Strategy Consortium, of which CAPACOA is an active member. Before the NCI, CAPACOA used to rely on the Labour Force Survey to monitor employment in the arts sector.
- Culture GDP is the economic value added associated with culture activities. This is the value added related to the production of culture goods and services across the economy, regardless of the producing industry.
- All GDP figures in this post are based on the real GDP. Real GDP is corrected to account for price changes. All real GDP figures are in constant 2012 dollars.
- Culture jobs are the number of jobs that are related to the production of culture goods and services.
- Culture is dominated by large seasonal fluctuations exhibiting similar patterns from one year to the next. For the convenience of users, these regular variations are removed from the NCI, through a statistical technique known as seasonal adjustment, to help isolate underlying trends.
- Culture Satellite Account statistics are grouped by domains and sub-domains. The definitions of culture domains and sub-domains can be found in the Conceptual Framework for Culture Statistics 2011. Mapping between culture domains and the North American Industry Classification System can be found in the Classification Guide for the Canadian Framework for Culture Statistics 2011.
Prepared by: Frédéric Julien, Director of Research and Development


Pingback: Budget recommendations for a lasting relaunch of the live performance sector - CAPACOA