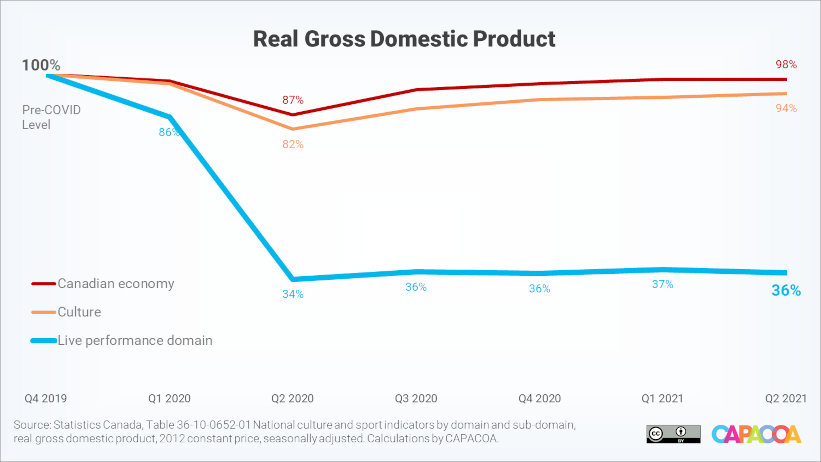
Despite a gradual easing of public health restrictions in the provinces and territories, performing arts companies, presenters and festivals still showed no signs of economic recovery in the second quarter of 2021. Here’s an overview of the latest National Culture Indicators.
Gross domestic product
Gross domestic product (GDP) for culture recorded its fourth consecutive increase in the second quarter of 2021. In contrast, the live performance domain saw its nominal GDP decline from $286 million to $281 million between the first and second quarters. In constant dollars, the real GDP in the live performance domain declined 2.9% in the second quarter. It was 64.0% below its pre-pandemic level.

By comparison, heritage and libraries, also considered to be among the hardest hit cultural industries, was 29.7% below its pre-pandemic level.
Employment
The employment situation is equally critical. Culture jobs increased by 0.8% in the second quarter. Live performance jobs declined 5.5%, to 36,489 in the second quarter. This is the lowest level of employment in this sector since the beginning of the pandemic.

Prior to the COVID-19 pandemic, there were 73,000 jobs in the live performance domain. This means that one in two (50.1%) live performance workers have lost their jobs since the start of the pandemic. By comparison, the heritage and library domain has lost 20.8% of its workforce since the beginning of the pandemic.
Timely support measures
These declines in GDP and employment came at a time when the federal government was implementing the Support for Workers in the Live Arts and Music Sectors Fund and several other targeted assistance measures, announced on March 2, 2021. As new programs take time to deliver and yield their intended effect, they likely did not have much impact on economic indicators for the second quarter. In fact, their full effect will likely not be felt until the third and fourth quarters of 2021. That said, the Labor Force Survey statistics do not currently hint at an improvement in the situation. According to the Labour Force Survey, employment in the performing arts, spectator sports and related activities [NAICS 711] sector was 107,800 in the third quarter. Taking into account seasonal fluctuations, this is in essence the same level of employment as in the second quarter, at 106,700.
Besides, anecdotal evidence from the field indicates the lifting of public health restrictions on capacity is not leading to a return of audiences just yet. In New Brunswick, where capacity restrictions were lifted on July 30, the Fredericton Playhouse reported that its attendance for the month of September was 30% lower than the same month in 2019. Similar situations are observed in Quebec, where theatres have been allowed to reopen at full capacity since October 8 (with the requirement for audience members to wear a mask throughout the performance). According to information gathered by Le Devoir, Quebec audiences are not rushing back either.
Under these circumstances, the newly elected government’s commitment to “launch a new Arts and Culture Recovery Program that will match ticket sales for performing arts” seems quite necessary and urgent. However, given the administrative delays inherent to program design, launch and rollout, the impact of such an investment on GDP and employment in the performing arts will not be measurable until at least next spring.
More information
National Culture Indicators in The Daily
About the National Culture Indicators
- The National Culture Indicators (NCI) provide timely and detailed economic statistics about the culture sector. The NCI are an extension of the Culture Satellite Account. They were developed by the Culture Statistics Strategy Consortium, of which CAPACOA is an active member. Before the NCI, CAPACOA used to rely on the Labour Force Survey to monitor employment in the arts sector.
- Culture GDP is the economic value added associated with culture activities. This is the value added related to the production of culture goods and services across the economy, regardless of the producing industry.
- All GDP figures in this post are based on the real GDP. Real GDP is corrected to account for price changes. All real GDP figures are in constant 2012 dollars.
- Culture jobs are the number of jobs that are related to the production of culture goods and services.
- Culture is dominated by large seasonal fluctuations exhibiting similar patterns from one year to the next. For the convenience of users, these regular variations are removed from the NCI, through a statistical technique known as seasonal adjustment, to help isolate underlying trends.
- Culture Satellite Account statistics are grouped by domains and subdomains. The definitions of culture domains and sub-domains can be found in the Conceptual Framework for Culture Statistics 2011. Mapping between culture domains and the North American Industry Classification System can be found in the Classification Guide for the Canadian Framework for Culture Statistics 2011.


