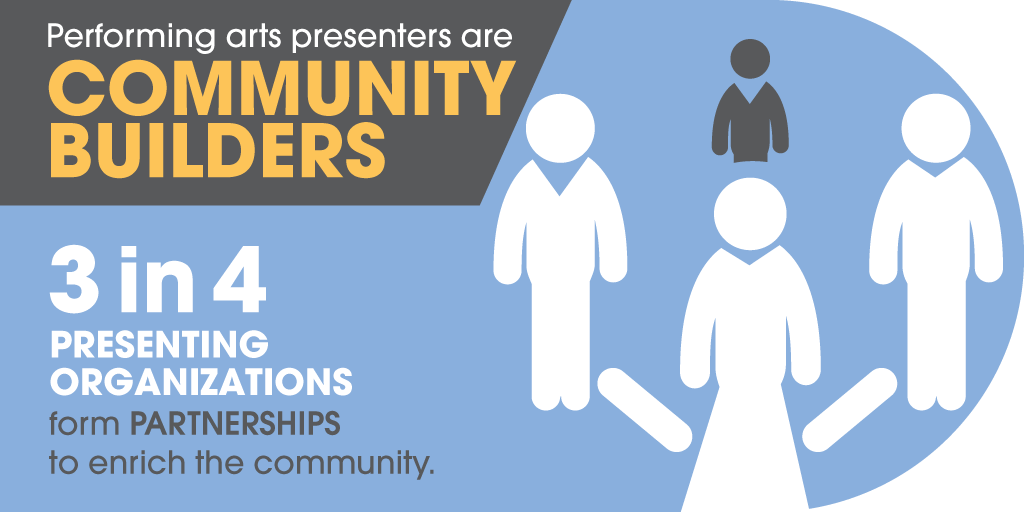
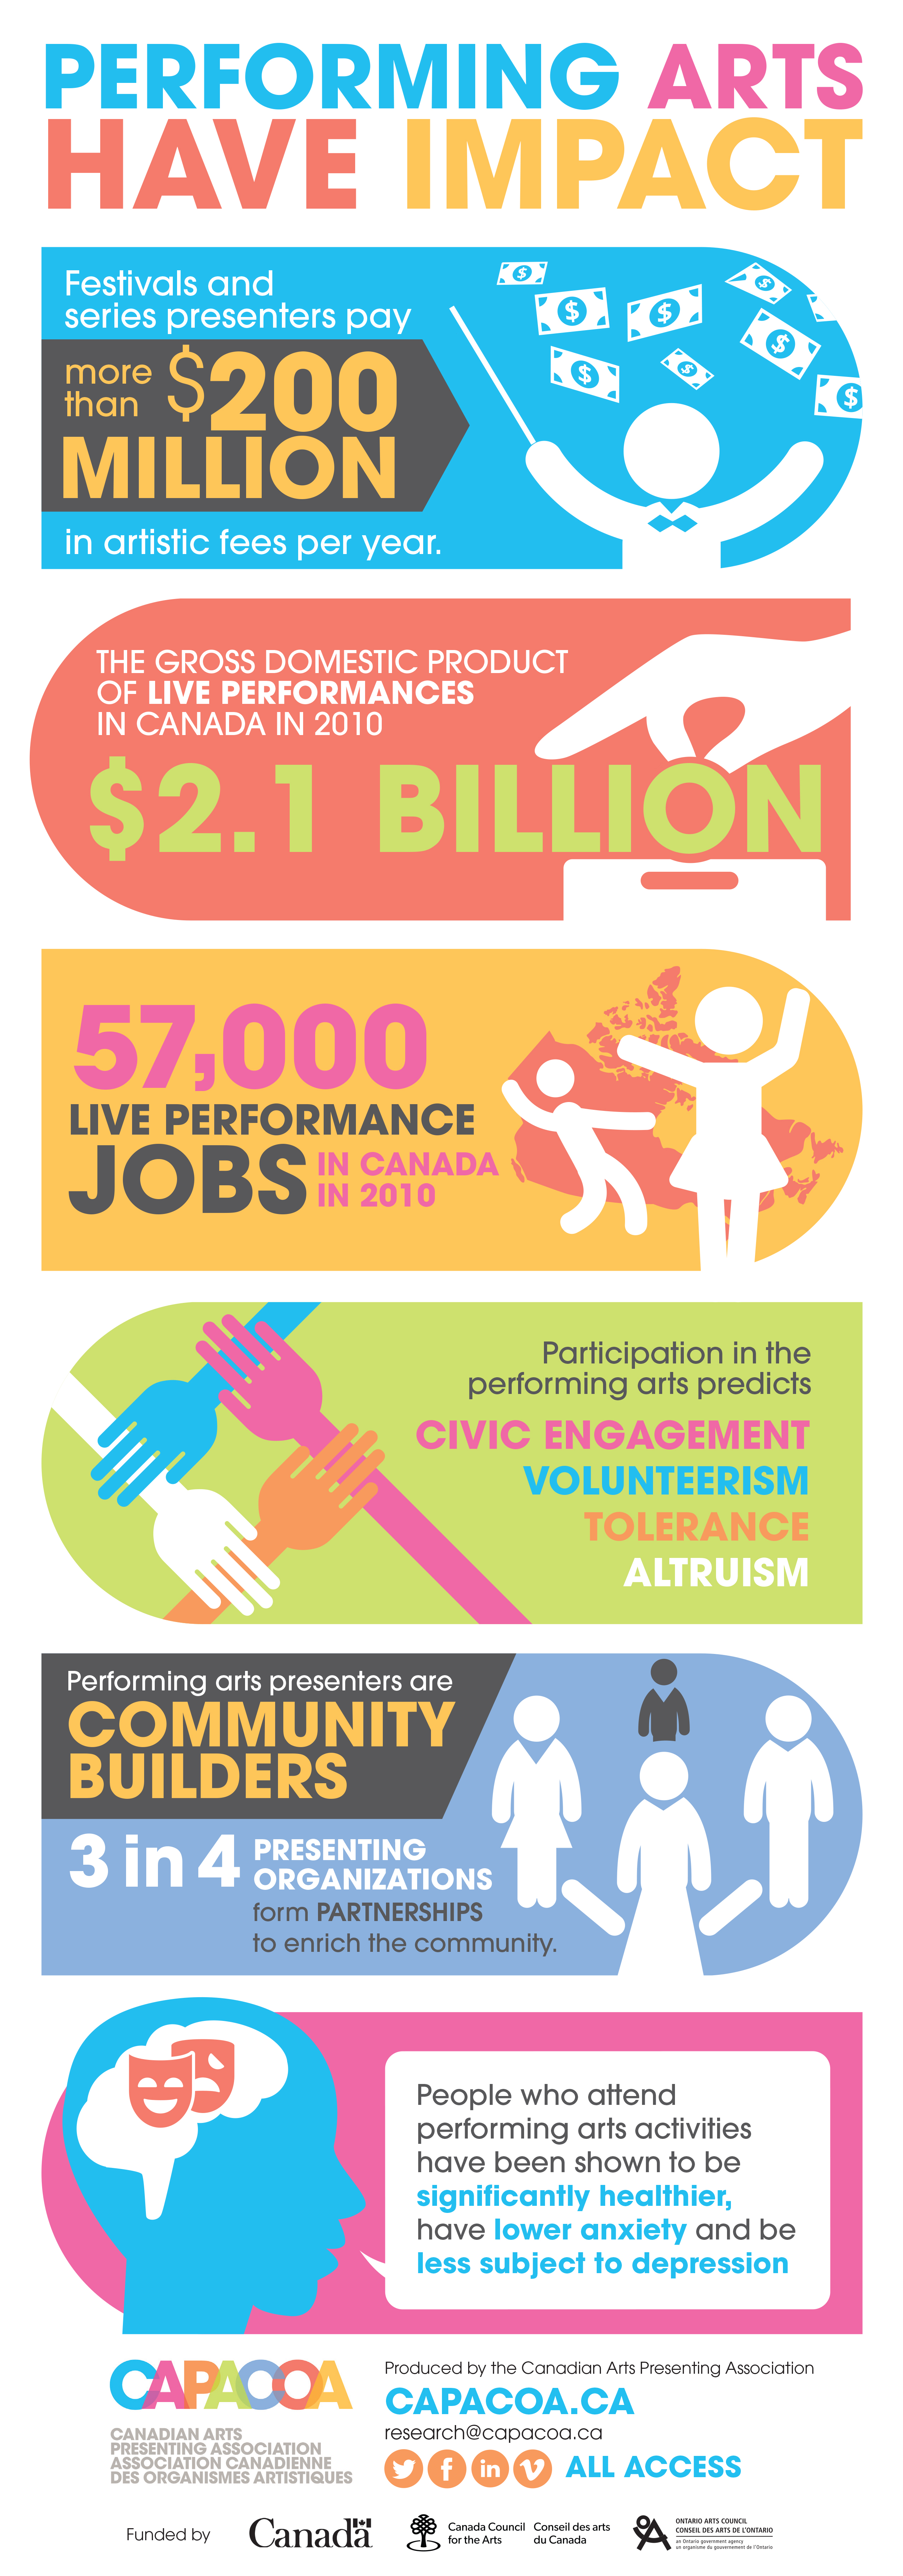
January 7, 2016 – In hundreds of communities across Canada, people and organizations are devoting their skills to bring together touring artists and audiences. Here is the realm of performing arts presentation in six infographics and detailed statistics.
These infographics highlight key findings from the Provincial and Territorial Culture Satellite Account, from Trends Among Recipients of the Canada Arts Presentation Fund, from The Value of Presenting, as well as from many other studies. They are available as stand-alone infographics (optimized for social media sharing), as a single image, and as a PDF. All are free to use, so share them widely.
The text version, sources and detailed notes are available in a print-ready handout. More performing arts statistics are also available in our arts promotion pages.
Full infographic
Other versions


