For the last three years, CAPACOA kept a relentless watch over indicators that could attest to the impact of the COVID-19 pandemic on the arts sector. These indicators have now stabilized and are starting to follow similar patterns as the Canadian economy as a whole. This suggests that the recovery phase is essentially completed and that whatever distance remains compared to pre-COVID levels should be considered the new post-COVID reality.
This page will no longer be regularly updated. Users are invited to instead refer to the CAPACOA’s regular Performing Arts Statistics page. Thanks for your readership and for your resilience.
Attendance and participation statistics
Soundbites from industry sources
Economic indicators from Statistics Canada
Gross Domestic Product
- Nominal culture GDP increased 2.0% to $16.0 billion during the first quarter of 2023; it has been steadily rising since the third quarter of 2020.
- Real culture GDP (taking inflation into account) was 3.9% above its pre-pandemic level in the first quarter of 2023.
- The real GDP for the live performance domain increased 3.1% during the first quarter of 2023. This was considerably better than the whole economy, which flatlined at 0.2%.
- As of the first quarter of 2023, real GDP for the live performance domain was still 5.3% away from its pre-pandemic level.

Source: Statistics Canada, Table 36-10-0652-01 National culture and sport indicators by domain and sub-domain, real GDP (constant 2012 dollars), seasonally adjusted, released: 2023-08-09. Calculations by CAPACOA.
Employment, National Culture Indicators
- Culture jobs stagnated at 717,227 during the first quarter of 2023 (0.1% growth). This was 7.9% higher than before the pandemic.
- Employment in the live performance domain increased 2.9% in the first quarter of 2023. At 76,960 jobs, employment in the live performance domain is 1.7% away from its pre-COVID level.
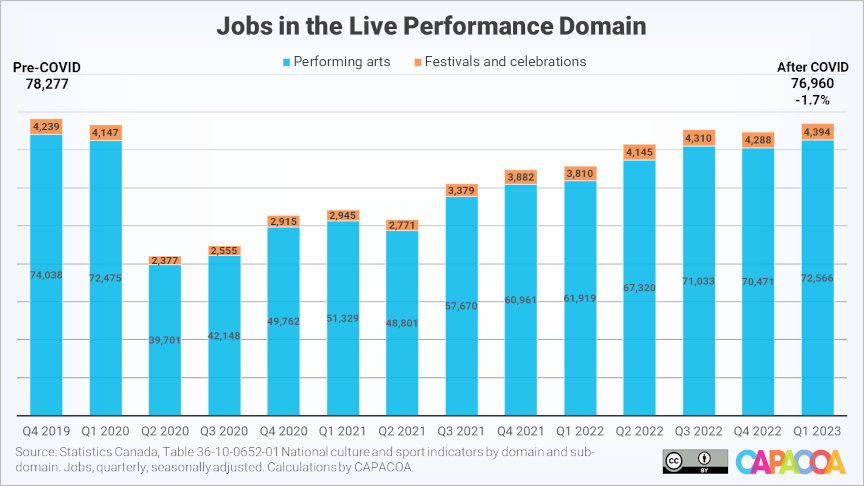
Source: Statistics Canada, Table 36-10-0652-01 National culture and sport indicators by domain and sub-domain, jobs, seasonally adjusted, released: 2023-08-09. Calculations by CAPACOA.
Revenue, Annual Survey of Service Industries
- The operating revenue of promoters (presenters) of performing arts, sports and similar events [NAICS 7113] was $2.1 billion in 2020 – this is a 46.0% decline compared to 2019 (43.3%, from 2018). Their operating profit margin was -4.1%.
Source: Statistics Canada, Table 21-10-0169-01 Spectator sports, event promoters, artists and related industries, summary statistics, released: 2022-03-09. Calculations by CAPACOA.
- The operating revenue of performing arts companies [NAICS 7111] was $1.8 billion in 2020 – this is a 30.7% decline compared to 2018. Their operating profit margin was 10.4% (1.1% among not-for-profit companies).
Source: Statistics Canada, Table 21-10-0182-01 Performing arts, summary statistics, released: 2022-01-24. Calculations by CAPACOA.
Additional statistics from the Performing Arts survey
Business conditions
- Arts, entertainment and recreation businesses [NAICS 71] expect similar obstacles as other industries over the next three months.
- Cost-related challenges are among the top challenges, with rising inflation (52.5%) being by far the top obstacle, but they are slightly less prevalent among arts, entertainment and recreation businesses than in other industries (see the table below).
- Arts, entertainment and recreation businesses are slightly more likely than other industries to anticipate obstacles related to recruiting and retaining skilled employees. (42.4% compared to 39.7%)
- Arts, entertainment and recreation businesses remain much more likely than other industries to report obstacles in attracting new or returning customers (28.7% compared to 19.1%).
- The businesses most likely to be optimistic about their future outlook were those in arts, entertainment and recreation (76.6%) and health care and social assistance (75.8%).
Business or organization obstacles over the next three months, first quarter of 2023
| Obstacle | All industries | Arts, entertainment and recreation | Percentage point difference |
|---|---|---|---|
| Rising inflation | 58.1 | 52.5 | -5.6 |
| Business expects obstacles related to recruiting and retaining skilled employees | 39.7 | 42.4 | 2.7 |
| Rising cost of inputs | 45.7 | 40.6 | -5.1 |
| Recruiting skilled employees | 34.0 | 33.9 | -0.1 |
| Shortage of labour force | 30.4 | 30.2 | -0.2 |
| Cost of insurance | 33.4 | 28.7 | -4.7 |
| Attracting new or returning customers | 19.1 | 28.7 | 9.6 |
| Retaining skilled employees | 25.2 | 28.0 | 2.8 |
| Rising interest rates and debt costs | 40.2 | 26.8 | -13.4 |
| Rising costs in real estate, leasing or property taxes | 28.6 | 22.5 | -6.1 |
| Fluctuations in consumer demand | 19.8 | 22.0 | 2.2 |
| Maintaining sufficient cash flow or managing debt | 19.0 | 20.8 | 1.8 |
| Transportation costs | 33.1 | 20.1 | -13.0 |
Source: Statistics Canada, Canadian Survey on Business Conditions, first quarter 2023. Released: 2023-02-27.
Business Counts
Between 2019 and 2022, the number of performing arts establishments, with or without employees, decreased 16.9%. Across all industry groups, the decrease was much more pronounced among establishments without employees (19.0%) than with employees (5.9%). The following table offers a breakdown by industry group.
| Industry group [NAICS classification] | 2019 Count | 2022 Count | Change (%) |
|---|---|---|---|
| Performing arts companies [7111] | 11,630 | 8,617 | -25.9% |
| Promoters (presenters) and festivals [711311, 711321, 711322] | 3,541 | 2,886 | -18.5% |
| Agents and managers for artists, entertainers and other public figures [711411] | 1,586 | 1,433 | -9.6% |
| Independent Actors, Comedians and Performers [711512] | 9,449 | 8,838 | -6.5% |
Table description:
– “Performing Arts Companies” [NAICS 7111] decreased from 11,630 to 8,617 (-25.9%);
– “Promoters (presenters)” and festivals [711311, 711321, 711322] decreased from 3,541 to 2,886 (-18.5%);
– “Agents and managers for artists, entertainers and other public figures” [711411] decreased from 1,586 to 1,433 (-9.6%);
– “Independent Actors, Comedians and Performers” [711512] decreased from 9,449 to 8,838 (-6.5%).
Source: Statistics Canada, Tables 33-10-0568-01, 33-10-0569-01, 33-10-00661-01, 33-10-00662-01, Canadian Business Counts, with and without employees, June and December 2022. Calculations by CAPACOA. NAICS industry categories included in these calculations are consistent with the mapping for the live performance domain in the Classification Guide for the Canadian Framework for Culture Statistics 2011.
Methodology: Data series from period 1 (June) and period 2 (December) were combined into an annual average.
Caveat: The Canadian Business Counts are not time series: they are not designed to be comparable across periods. This data should therefore be interpreted and used with caution.
Attendance and participation statistics
Arts Response Tracking Survey
Business / Arts, the National Arts Centre and Nanos Research have conducted a series of surveys of Canadians’ attitudes on returning to indoor and outdoor arts and culture events.
- The eleventh edition of the survey is dated January 2023.
WolfBrown COVID-19 Audience Outlook Monitor – Ontario
This audience survey is conducted by WolfBrown on behalf of the Ontario Arts Council and the Toronto Alliance for the Performing Arts. 80 organizations have surveyed their patrons as part of this initiative.
- The eigth deployment of the Audience Outlook Monitor took place in October 2022.
The New Experience Economy
Stone Olafson, in collaboration with community partners, has been conducting a longitudinal study with Alberta audiences.
- The sixth phase of The New Experience Economy was conducted in May 2022.
Soundbites from industry sources
- Arts and culture workers anticipate an 18-month recovery period and as many as one in three (35%) are uncertain about their future in the arts.
- Arts and culture organizations are much more optimistic about the ability of their own organization to recover from the impacts of COVID-19 (67%) than they are about the ability of the industry as a whole to recover (42%).
- Over three times as many individuals AND organizations report very high or high levels of stress and anxiety today (76% and 79%, respectively) as compared to before COVID-19 (26% and 25%).
Source: Prairie Research Associates, National Arts and Culture Impact Survey, January 2020. Survey of individuals and organizations conducted in November 2020; n=2,001.
- Only 6% of “arts, recreation & information” businesses reported normal or better revenues than usual in November.
- “Arts, recreation & information” businesses are most likely to agree that there are sector-specific challenges that are not currently being addressed by their provincial government. 50% strongly agree and 20% somewhat agree.
- Owners of “arts, recreation & information” businesses are the most likely to report psychological health issues: 10 percentage points above the 48% average.
Source: Canadian Federation of Independent Businesses, COVID-19: State of Small Business, November 2020. Survey of CFIB members started November 20, 2020; n=4,127.
- 2/3 (65%) of festivals and events will not return next year or are uncertain whether they can return if there is not a bailout program created to wipeout deficits created by the impacts of COVID-19.
- 2/3 of festivals and events have had to lay off staff (48%) or have reduced employee hours (28%). There was an average 50% reduction in the workforce of those organizations who have had to lay off staff.
Source: Festivals and Major Events Canada, COVID-19: Survey of Festivals and events in Canada, August 2020.
About this web page
This webpage was built with the goal of making it easier for everyone in the performing arts sector to access the latest and most relevant economic indicators during the time of COVID-19.
Most statistics provided on this page are the result of custom calculations and, as such, can be subject to occasional errors. Users are encouraged to refer to the sources, to read methodological notes, and to run their own calculations.
More statistics can be accessed on Hill Strategies’ Arts Research Monitor, via the Culture Satellite Account or on CAPACOA’s page of performing arts statistics.
Questions or comments about these statistics can be addressed to Frédéric Julien, Director of Research and Development at CAPACOA.
This webpage was maintained and updated collaboratively by CAPACOA, Mass Culture, Fédération culturelle canadienne-française, and the Cultural Human Resources Council in support of the important work done by Statistics Canada, the Cultural Statistics Strategy Consortium, and partner arts service organizations.
Last updated: August 29, 2023